In B2B enterprise hiring, interviews have moved past superficial ad metrics and resume overviews. Hiring panels of CMOs, CROs, and Finance leaders evaluate candidates through situational simulations. You are given a high-stakes prompt: "You are our Head of Growth. Paid acquisition spend rose 45% this quarter and MQLs jumped 60%, but pipeline velocity stalled and CAC payback stretched from 12 to 21 months. The CRO claims marketing is buying low-intent traffic, while the CFO wants to cut paid budgets in half. Walk us through your diagnosis and recovery plan."
Navigating a b2b growth marketing case study attribution interview requires command of multi-touch attribution mechanics, data pipeline literacy, pipeline conversion math, and seasoned executive diplomacy.
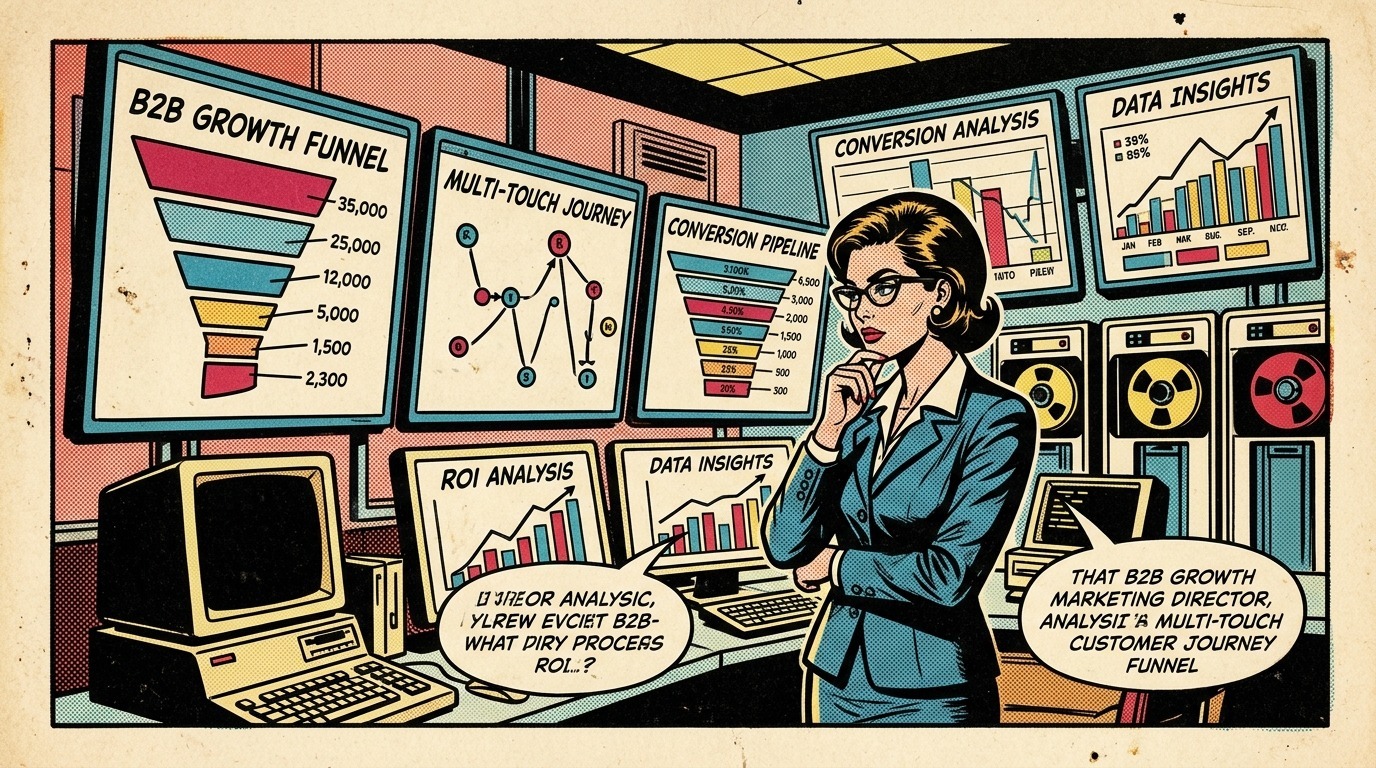
This guide provides an end-to-end blueprint for growth marketing roleplay interviews. We examine attribution architecture, walk through executive simulations, present SQL diagnostic queries, provide scoring rubrics, and explore strategies covered in our growth marketing interview questions archive.
1. The Multi-Touch Attribution Engine in B2B SaaS
Enterprise B2B sales cycles span six to twelve months, involving multiple stakeholders across engineering, security, finance, and operations. Consumer single-touch models distort strategic decisions in B2B.
Relying on Last-Touch attribution awards downstream sales touches 100% of pipeline credit, starving top-of-funnel content of budget. Conversely, First-Touch overvalues casual discovery while ignoring middle-of-funnel nurture workflows.
To structure persuasive answers during case study interviews, growth leaders must understand each major attribution model and recognize its operational trade-offs.
| Attribution Model | Credit Allocation Formula | Optimal Use Case | Systematic Vulnerability | Interview Defense Trap |
|---|---|---|---|---|
| First-Touch | 100% to initial discovery interaction. | Brand awareness, early top-of-funnel channels. | Ignores months of nurturing and sales enablement. | Candidates credit discovery but miss conversion stalls. |
| Last-Touch | 100% to final interaction before conversion. | E-commerce, self-serve PLG signups. | Overvalues brand search; starves awareness programs. | Interviewers challenge why brand search claims all pipeline. |
| Linear | Equal percentage across touchpoints (1/N). | Multi-channel baseline tracking with stable touch counts. | Treats casual blog visits identically to executive demos. | Fails to reward high-leverage inflection milestones. |
| Time-Decay | Exponential decay weighting recent touches (2^(-t/λ)). | Mid-market deals with clear acceleration phases. | Undervalues foundational problem-identification content. | Penalizes long intervals typical of security reviews. |
| W-Shaped | 30% First, 30% Lead, 30% Opp Creation, 10% nurture. | Complex enterprise multi-stakeholder journeys. | Sensitive to arbitrary CRM milestone definitions. | The industry benchmark candidates must defend. |
| Data-Driven | Shapley Value or Markov Chain probability modeling. | Large datasets (>5,000 won opportunities annually). | "Black box" opacity challenging stakeholder alignment. | Interviewers test candidates on Shapley logic without jargon. |
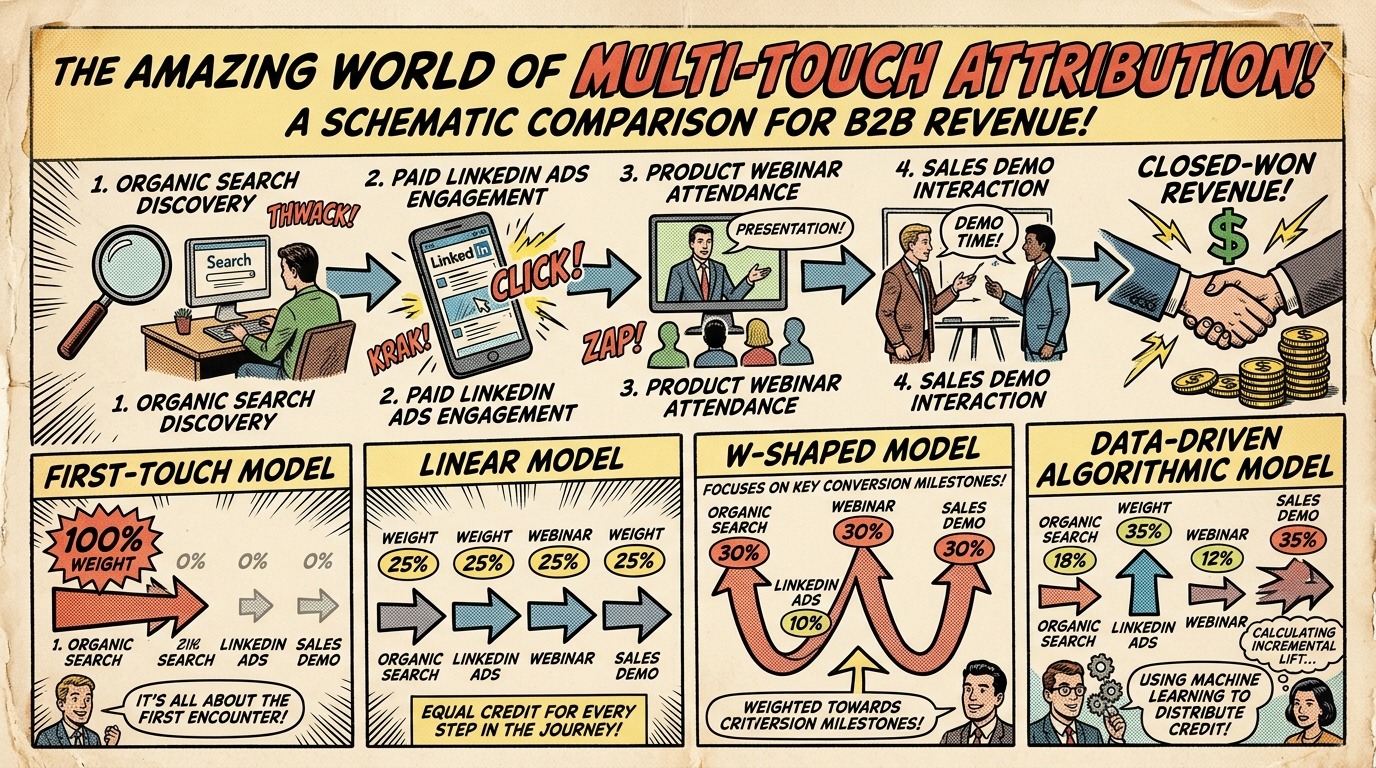
When asked what attribution model to deploy on day one, avoid suggesting complex machine learning models immediately. Propose a pragmatic W-Shaped baseline mapped to CRM stages, paired with incrementality tests.
2. Roleplay Scenario 1: The MQL Surge and Pipeline Collapse
The Interviewer's Prompt
"You joined a Series B B2B developer platform three months ago. In Q3, your demand generation team scaled paid spend on LinkedIn and Google Search by 45%, generating a 60% surge in MQLs. However, sales closed-won revenue finished 18% below plan, sales cycle length expanded from 42 to 74 days, and SDRs report that lead quality is unworkable. In ten minutes, you are presenting to the CEO and CRO. How do you diagnose the root cause, and what immediate operational changes do you execute?"
Strategic Anatomy of an Exceptional Response
Weaker candidates defend marketing performance by citing low Cost Per Click (CPC) or raw form fills, blaming sales for poor follow-up hygiene. Principal growth leaders take end-to-end accountability for revenue outcomes and structure their diagnosis across four analytical pillars:
- Funnel Stage-Gate Conversion Audit: Isolating where drop-off occurred along the MQL → Sales Accepted Lead (SAL) → Sales Qualified Opportunity (SQO) → Closed-Won pathway.
- Audience Intent Calibration: Differentiating between educational curiosity clicks (downloadable PDF checklists) versus high-intent product evaluation (pricing calculators, architectural sandboxes, self-serve API keys).
- Firmographic and ICP Compliance: Checking if paid campaigns inadvertently loosened targeting criteria (company size, tech stack, buyer persona title) to meet volume quotas.
- Data Hygiene & Follow-Up SLA: Verifying CRM routing latency, automated qualification filters, and lead enrichment accuracy.
Concrete Diagnostic SQL Walkthrough
Interviewers test whether candidate claims are backed by data fluency. Demonstrating how you query raw event logs and CRM tables shows technical command, connecting with skills highlighted in our SQL interview questions for data and marketing analytics guide.
-- Diagnostic Query: Funnel Conversion Velocity and Win Rates by Campaign
WITH touchpoint_summary AS (
    SELECT
        c.campaign_name,
        c.channel_grouping,
        o.opportunity_id,
        o.is_won,
        o.acv_amount,
        DATEDIFF('day', o.created_date, o.close_date) AS cycle_days,
        CASE
            WHEN tp.is_first_touch = TRUE THEN 0.30
            WHEN tp.is_lead_creation = TRUE THEN 0.30
            WHEN tp.is_opp_creation = TRUE THEN 0.30
            ELSE 0.10 / NULLIF(COUNT(*) OVER (PARTITION BY o.opportunity_id), 0)
        END AS w_weight
    FROM analytics_dw.attribution_touchpoints tp
    JOIN analytics_dw.crm_opportunities o ON tp.opportunity_id = o.opportunity_id
    JOIN analytics_dw.marketing_campaigns c ON tp.campaign_id = c.campaign_id
    WHERE tp.touchpoint_timestamp >= CURRENT_DATE - INTERVAL '90 days'
)
SELECT
    campaign_name,
    channel_grouping,
    COUNT(DISTINCT opportunity_id) AS total_opportunities,
    ROUND(SUM(CASE WHEN is_won THEN acv_amount * w_weight ELSE 0 END), 2) AS attributed_pipeline_revenue,
    ROUND(AVG(cycle_days), 1) AS avg_sales_cycle_days,
    ROUND(COUNT(DISTINCT CASE WHEN is_won THEN opportunity_id END)::FLOAT /
          NULLIF(COUNT(DISTINCT opportunity_id), 0) * 100, 2) AS win_rate_percentage
FROM touchpoint_summary
GROUP BY 1, 2
ORDER BY attributed_pipeline_revenue DESC;
Verbal Executive Roleplay Script
*"When lead volume expands while revenue degrades, the team has optimized for top-of-funnel proxies rather than buying intent.
Here is my turnaround plan:
- ICP Triage: Segment incremental MQLs by company size, tech stack, and persona. If volume came from non-ICP downloads, our bidding drifted toward low-intent consumer clicks.
- Budget Reallocation: Pause the bottom quartile of ad sets with zero Stage 2 pipeline conversion, shifting spend toward high-intent product comparison terms and retargeting accounts reading our API documentation.
- SDR Alignment: Review thirty recorded discovery calls with the SDR lead to diagnose whether routing lag or mismatched ad expectations stalled conversion.
Marketing's ultimate scorecard is Net New ARR, not form fills."*
This response demonstrates composure, protects budget from being indiscriminately slashed, and re-anchors the discussion on commercial metrics explored in performance marketing interview questions.
3. Roleplay Scenario 2: The Multi-Department Attribution Dispute
The Interviewer's Prompt
"Our enterprise deal size is $120,000 ACV. On a marquee closed-won deal with a Fortune 500 bank, three teams claim primary credit: Demand Gen points to an initial paid LinkedIn whitepaper download eight months ago; Product Marketing points to an executive webinar attended by the VP of Engineering; and Field Sales claims their Strategic Account Executive engaged the CIO through an executive dinner. How do you resolve this attribution dispute without demoralizing any department?"
Navigating Credit Friction in Executive Panels
Attribution disputes are alignment questions disguised as technical problems. Inexperienced candidates declare a single winner; veteran leaders recognize that B2B deals require multi-threaded execution.
[Month 1] Paid LinkedIn Whitepaper (Demand Gen) ──> 30% First-Touch Weight
    │
    ▼
[Month 3] Technical Benchmark Report Download ──> 30% Lead Creation Weight
    │
    ▼
[Month 5] Enterprise Architecture Webinar (PMM) ──> Middle-Nurture Touch
    │
    ▼
[Month 6] Security Review & Demo ──> 30% Opportunity Creation Weight
    │
    ▼
[Month 8] Executive CIO Dinner & Negotiation (Sales) ──> Close Touch
Recommended Resolution Framework
- Decouple Compensation from Attribution Models: Tying sales commissions or marketing bonuses directly to single-touch CRM fields breeds organizational friction. Field sales must be compensated on quotas; marketing must be measured on pipeline contribution and CAC payback velocity.
- Apply W-Shaped Opportunity Weighting: Demand Gen receives 30% credit for originating account awareness, Product Marketing receives middle-touch credit for technical webinars, and Opportunity Creation shares 30% for catalyzing evaluation.
- Implement Self-Reported Attribution: Pair digital tracking with qualitative demo form fields ("How did you hear about us?"). Prospects often reveal dark-social discovery that software cookies miss. Blending qualitative and quantitative data resolves credit disputes.
4. Financial Modeling: CAC, LTV, and Payback Calibration
A growth leader who cannot calculate unit economics will struggle in executive interview rounds. Hiring committees frequently ask candidates to calculate CAC payback periods on a whiteboard to test commercial literacy, intersecting with principles detailed in our financial modeling and variance analysis guide.
Core Mathematical Formulas
Blended CAC = Total Fully-Loaded Sales & Marketing Expenses / New Customers Acquired

CAC Payback Period (Months) = Blended CAC / (Average Monthly Revenue per Customer × Gross Margin %)
Whiteboard Scenario Calculation
Suppose an enterprise SaaS company presents the following quarterly metrics:
- Quarterly Sales & Marketing Spend: $1,800,000 (Media: $600k, SDR/Sales Salaries: $800k, Marketing Tools & Team: $400k).
- New Customers Acquired: 30 enterprise logos.
- Average Annual Contract Value (ACV): $80,000 (approximately $6,667 MRR per customer).
- Software Gross Margin: 80%.
Calculations:
- Blended CAC:
$1,800,000 / 30 = $60,000per new customer. - Monthly Gross Profit Contribution:
$6,667 × 0.80 = $5,333.60. - CAC Payback Period:
$60,000 / $5,333.60 ≈ 11.25 months.
If asked where to investigate when payback doubles, evaluate whether media costs inflated without conversion efficiency, ACV shrank from discounting, or sales cycles elongated into future quarters.
5. Quantitative Evaluation Rubric: How Hiring Panels Score You
Hiring panels grade B2B growth marketing candidates against an explicit four-dimensional evaluation matrix. Understanding these standards helps you calibrate your interview answers to Director and VP levels.
| Dimension | Developing (Level 1) | Proficient (Level 2) | Master / Executive Standard (Level 3) |
|---|---|---|---|
| Funnel Diagnosis | Focuses on ad metrics (impressions, clicks, MQLs). Blames sales for slow follow-up. | Evaluates stage drop-offs (MQL → SQL → Win). Audits enrichment and qualification criteria. | Diagnoses velocity, cohort win rates, ICP fit distribution, and sales cycle duration impacts. |
| Attribution Mechanics | Relies on First-Touch or Last-Touch GA dashboards. | Deploys W-shaped multi-touch attribution; manages CRM campaign tracking. | Combines CRM weighting with incrementality tests, holdouts, and self-reported attribution. |
| Capital Allocation & CAC | Manages campaigns to a static CPL or monthly spend limit. | Measures blended and channel CAC; understands basic LTV-to-CAC ratios. | Models channel CAC payback, marginal efficiency curves, and ARR return on capital. |
| Cross-Functional Presence | Becomes defensive when ad quality is questioned by peers. | Collaborates with sales leadership during weekly pipeline reviews. | Partners with CRO and CFO as a trusted peer; aligns on pipeline SLAs and CAC targets. |
Targeting Level 3 behaviors demonstrates strategic maturity, mirroring patterns in our enterprise sales interview questions prep.
6. High-Pressure Behavioral Traps and How to Defend Them
Interviewers frequently introduce adversarial questions to test emotional composure. If pressed with unexpected curveballs, apply frameworks for handling high-pressure unknown interview questions.
Trap 1: "Third-party cookies are dying and Safari ITP blocks tracking. Isn't multi-touch attribution a waste of time?"
Recommended Defense:
"Privacy restrictions and Apple ITP eliminated fragile client-side cookies. However, abandoning attribution is a false choice. Modern growth teams migrate to first-party server-side tracking, account-based IP resolution, and self-reported form fields. Multi-touch attribution guides directional allocation, while quarterly incrementality lift tests verify causality. Attribution is a decision-support framework, not an accounting ledger."
Trap 2: "Our SDR team generated 60% of our pipeline through cold outbound email. Why should we invest in content or growth marketing at all?"
Recommended Defense:
"Cold outbound efficiency decays rapidly in an awareness vacuum. Without brand familiarity, SDR response rates hover below 1.5%, compounding acquisition costs. When growth marketing provides brand air cover, technical content, and category education, SDR positive responses double and sales cycles compress. Outbound and demand generation are complementary flywheels, not competing silos."
7. Interactive Mock Practice for Growth Interviews
Mastering roleplay interviews requires spoken repetition under pressure. Reading frameworks builds comprehension, but articulating trade-offs live requires practice.
To sharpen your executive delivery:
- Run timed 60-second answers using our 60-Second Job Blitz to practice rapid-fire funnel troubleshooting scenarios.
- Simulate comprehensive CMO and CRO executive panel interviews with customized AI interviewer personas using totop.app pricing plans.
- Benchmark your foundational interview readiness using our structured technical interview preparation blueprint.
Structured preparation transforms stressful simulations into an opportunity to showcase decisive, revenue-driven growth leadership.
Practice Growth Marketer Questions Live with AI Mock Interviews
Turn any job description across Engineering, DevOps, Data, Marketing, Sales, Finance, or HR into a personalized test and live voice or text AI mock interview on totop.app, or test your speed right now in the 60-Second Growth Marketer Blitz.
Play 60s Growth Marketer Blitz (Free, No Login) | Start 14-Day Free Trial | Browse All Interview Guides