In corporate finance hiring, standard formula tests have been replaced by real-world case simulations. Hiring committees evaluate how candidates handle complex situational prompts: "You are an FP&A Lead stepping into our executive meeting. Revenue beat budget by twelve percent, yet operating cash flow turned negative. The CFO wants answers in three minutes. Walk us through your diagnosis."
Succeeding in an fpa three statement modeling variance analysis interview requires mechanical fluency across interconnected accounting statements, mathematical precision in isolating price versus volume drivers, and structured executive communication.

This guide deconstructs the three-statement modeling engine, walks through real-world case studies, provides an executive evaluation rubric, and equips you with actionable strategies for your next finance interview.
1. The Three-Statement Interconnection Engine
At the core of corporate finance interviews is the dynamic flow between the Income Statement (P&L), the Balance Sheet, and the Cash Flow Statement (CFS).
+-------------------------------------------------------------+
|                      INCOME STATEMENT                       |
|  Revenue -> COGS -> Gross Profit -> OpEx -> Operating Income |
|         -> Interest & Taxes -> NET INCOME                   |
+------------------------------+------------------------------+
                               |
                               v
+-------------------------------------------------------------+
|                    CASH FLOW STATEMENT                      |
|  Operating: Net Income + Non-Cash (D&A) - Working Capital   |
|  Investing: Capital Expenditures (CapEx), Asset Sales       |
|  Financing: Debt Borrowing/Repayment, Equity, Dividends      |
|  NET CHANGE IN CASH = Ending Cash Balance                   |
+------------------------------+------------------------------+
                               |
                               v
+-------------------------------------------------------------+
|                       BALANCE SHEET                         |
|  Assets: Cash (from CFS), Accounts Receivable, PP&E (net)   |
|  Liabilities: Accounts Payable, Accrued Expenses, Debt      |
|  Equity: Common Stock + Retained Earnings (Net Income - Div)|
|  CHECK: Total Assets = Total Liabilities + Equity           |
+-------------------------------------------------------------+
The Three Critical Linkages Every Candidate Must State
When asked how the three statements connect, state these three core mechanisms:
- Net Income to Operating Cash and Retained Earnings: Net income from the Income Statement starts Cash Flow from Operations (CFO). Concurrently, Net Income (minus dividends) flows into Retained Earnings on the Balance Sheet.
- Non-Cash Adjustments and Working Capital Shifts: Non-cash P&L expenses—such as Depreciation (D&A) and Stock-Based Compensation (SBC)—are added back in CFO. Operating asset increases consume cash, while liability increases generate cash.
- Closing Cash Balances the Balance Sheet: Net cash flow across Operations, Investing, and Financing updates Ending Cash on the Balance Sheet, ensuring Assets equal Liabilities plus Equity.
Mastering this fundamental flow provides the baseline needed for technical financial modeling interview questions.
2. Interactive Roleplay Case Study 1: The Multi-Year Asset & Debt Transaction
A classic interview prompt tests your ability to trace a multi-period capital transaction:
Interviewer Prompt: "On January 1, our company purchases $10 million of server equipment, funded with $5 million in long-term debt at 8% annual interest and $5 million in cash. The equipment has a 5-year useful life, zero salvage value, and uses straight-line depreciation. The corporate tax rate is 20%. Walk me through statement impacts at transaction close (Year 0) and at the end of Year 1."
Step 1: Transaction Close (Year 0)
At transaction close, no operating activity or depreciation has occurred:
- Income Statement: No impact ($0 Net Income change).
- Cash Flow Statement: CapEx is -$10M under CFI. Debt Issuance is +$5M under CFF. Net change in cash is -$5M.
- Balance Sheet: Cash drops by $5M, PP&E rises by $10M (Total Assets net +$5M). Debt rises by +$5M under Liabilities. Equity is unchanged. Total Assets ($+5M) equals Total Liabilities ($+5M).
Step 2: Full Operating Year (Year 1)
During Year 1, operations, interest expense, and depreciation commence:
- P&L Expenses: Straight-line depreciation is $2.0M/year ($10M / 5). Debt interest is $0.4M ($5M * 8%). Pre-Tax Income falls by $2.4M. The 20% tax shield saves +$0.48M. Net Income drops by -$1.92M.
- Cash Flow Statement: Net income starts at -$1.92M. Add back non-cash depreciation of +$2.0M. CFO is +$0.08M. CFI and CFF are $0. Net change in cash is +$0.08M.
- Balance Sheet: Cash rises by +$0.08M. Net PP&E falls to $8.0M ($10M gross - $2M dep). Total Assets drop by -$1.92M ($0.08M cash - $2.0M PP&E). Liabilities remain unchanged ($5M debt). Retained Earnings drops by -$1.92M from Net Income. Total Assets (-$1.92M) equals Total Liabilities ($0) plus Equity (-$1.92M).
Summary Table: Transaction Flow Mechanics
| Accounting Metric | Year 0 (Close) | Year 1 (Operations & Dep) |
|---|---|---|
| Operating Income (EBIT) | $0.00M | -$2.00M (Depreciation) |
| Interest Expense | $0.00M | -$0.40M ($5M debt at 8%) |
| Tax Impact (20%) | $0.00M | +$0.48M (Tax shield) |
| Net Income Impact | $0.00M | -$1.92M |
| Operating Cash Flow (CFO) | $0.00M | +$0.08M (-$1.92M Net Income + $2M D&A) |
| Investing Cash Flow (CFI) | -$10.00M (CapEx) | $0.00M |
| Financing Cash Flow (CFF) | +$5.00M (Debt) | $0.00M |
| Net Change in Cash | -$5.00M | +$0.08M |
| Ending Net PP&E | +$10.00M | +$8.00M ($10M - $2M dep) |
| Ending Long-Term Debt | +$5.00M | +$5.00M |
| Retained Earnings | $0.00M | -$1.92M |
| Balance Equilibrium | Assets +$5M = Debt +$5M | Assets -$1.92M = Equity -$1.92M |
3. Interactive Roleplay Case Study 2: Price-Volume-Mix (PVM) Variance Analysis
The second pillar of the interview is variance decomposition. When preparing monthly budget-versus-actual (BvA) reporting, leadership demands decomposition into actionable drivers.
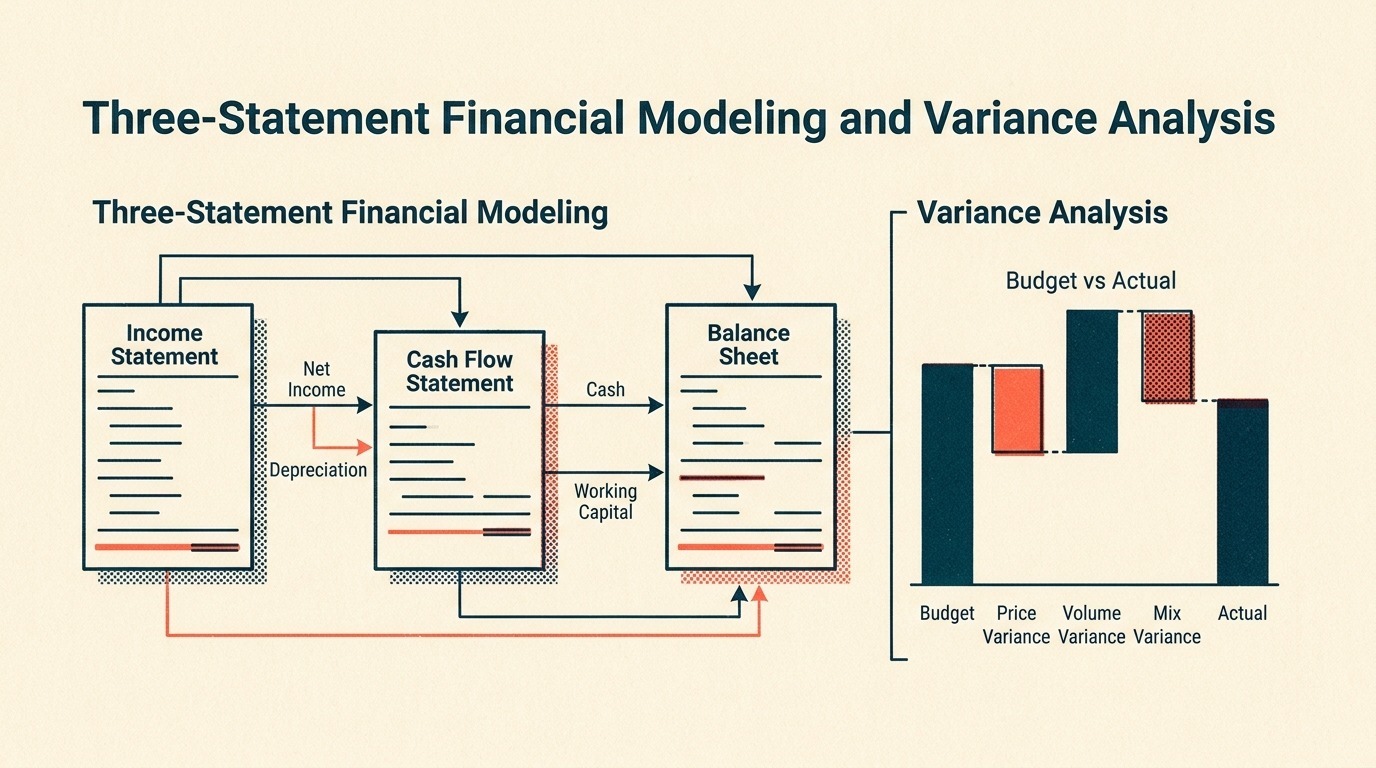
The Classical PVM Framework
Variance decomposition separates total revenue and margin deltas into four distinct mathematical components:
- Price Variance:
Actual Units Sold * (Actual Unit Price - Budgeted Unit Price) - Volume Variance:
(Actual Units Sold - Budgeted Units Sold) * Budgeted Unit Margin - Mix Variance:
Total Actual Units * (Actual Product Mix % - Budgeted Product Mix %) * (Budgeted Product Margin - Budgeted Average Margin) - Cost / Efficiency Variance:
Actual Units Sold * (Budgeted Cost Per Unit - Actual Cost Per Unit)
Case Study Scenario: The SaaS Enterprise vs. Self-Serve Mix Shift
Consider this real-world case study interview prompt:
Executive Prompt: "In Q2, our B2B SaaS platform booked $12.0M in revenue against a plan of $10.0M—a $2.0M beat. However, our Gross Margin dropped from an anticipated 75% down to 65%, and operating cash burn widened by $800,000. You are presenting to leadership. What drove this divergence, and how do you explain it?"
Operational Data Breakdown
Examining the numbers reveals two product tiers:
- Enterprise Tier (High Gross Margin):
- Budget: 50 contracts at $120k ACV = $6.0M revenue (85% gross margin).
- Actual: 35 contracts at $110k ACV = $3.85M revenue (80% gross margin).
- Self-Serve Developer Tier (Lower Gross Margin with Cloud API Costs):
- Budget: 40,000 seats at $100 ARPU = $4.0M revenue (60% gross margin).
- Actual: 75,000 seats at $108.67 ARPU = $8.15M revenue (58% gross margin).
Mathematical Decomposition
- Enterprise Variance: 15 fewer Enterprise deals reduced expected gross profit by -$1.53M (15 * $120k * 85%). ACV discounting reduced revenue by -$350k on closed accounts.
- Self-Serve Variance: Self-serve seats expanded by 35,000 seats over budget, delivering +$2.10M in incremental gross profit (35k seats * $100 * 60%), with price realization adding +$650k.
- Mix Shift Impact: Product composition shifted from 60% Enterprise / 40% Self-Serve in plan to 32% Enterprise / 68% Self-Serve in actuals. Because self-serve carries heavier hosting costs (42% COGS vs. 15% Enterprise COGS), blended gross margin compressed by 1,000 basis points.
- Working Capital and Cash Burn Linkage: Enterprise contracts bill upfront annual cash (driving deferred revenue). Self-serve contracts bill monthly in arrears, while hosting payables matured faster than collections. Consequently, the volume beat drove an immediate Accounts Receivable surge without upfront Enterprise cash injection, expanding cash burn by $800k.
The 60-Second Executive Synthesis
When answering in an interview, frame your answer using structured executive storytelling:
*"Our $2.0M revenue beat was driven by explosive 87% volume growth in our developer self-serve tier. However, gross margin contracted from 75% to 65% due to an adverse mix shift: Enterprise closings lagged budget by 30%, while our lower-margin self-serve tier expanded to represent 68% of total revenue.
Furthermore, because Enterprise deals provide annual upfront cash while self-serve bills monthly in arrears alongside immediate hosting liabilities, working capital deteriorated, expanding our cash burn by $800,000. In Q3, we recommend establishing minimum ACV discounting guardrails, optimizing cloud API tiering, and introducing annual prepay incentives for self-serve accounts."*
4. Evaluation Rubric: How Interview Panels Score Candidates
During an FP&A case study, interviewers evaluate you across four competencies:
| Competency Dimension | Developing (Junior) | Strong (Senior) | Exceptional (Lead / Director) |
|---|---|---|---|
| Accounting Mechanics | Confuses cash and accrual; misses tax shield. | Balances three statements; states D&A flow. | Handles non-linear items (leases, deferred tax, SBC). |
| Variance Decomposition | Quotes raw dollar deltas without root causes. | Isolates Price, Volume, and Cost variances accurately. | Decomposes Price, Volume, Mix, and FX; assesses elasticity. |
| Commercial Acumen | Treats models as static academic spreadsheets. | Maps financial deviations to operational teams. | Connects variances to unit economics, payback, and churn. |
| Executive Storytelling | Recites spreadsheet line items without structure. | Uses structured top-down communication (headline, drivers). | Delivers concise executive synthesis and actionable mitigation. |
For candidates looking to calibrate their performance, testing your timing through a simulated interview readiness quiz can highlight blind spots before facing live panels.
5. Diagnostic Framework: When Cash and Net Income Diverge
Another frequent interview question tests diagnostic intuition:
Interviewer Question: "Our P&L shows that Net Income expanded 35% year-over-year to record profitability, but Operating Cash Flow flipped from positive $15 million to negative $4 million. What are the first three areas you investigate?"
Group your response into three systemic balance sheet mechanisms:
1. Working Capital Expansion: Accounts Receivable & DSO
The primary driver of cash divergence is uncollected revenue. If sales accelerated quarterly bookings with flexible 90-day payment terms, revenue is recognized under accrual accounting (ASC 606), boosting Net Income. However, until customers pay, Accounts Receivable expands and cash drops. Calculate Days Sales Outstanding (DSO) to verify collection delays:
DSO = (Ending Accounts Receivable / Total Credit Sales) * Number of Days in Period
2. Inventory Accumulation: Holding Costs & Supply Chain Mismatches
In manufacturing or hardware companies, cash can be tied up in raw materials, work-in-progress, or finished goods inventory. Inventory purchases do not hit the P&L until sold as COGS. If procurement built safety stock to hedge against supply chain risks, cash leaves the company while Net Income remains pristine. Measure Days Inventory Outstanding (DIO) to identify stock aging:
DIO = (Average Inventory / COGS) * Number of Days in Period
3. Deferred Revenue Consumption & Payables Timing
In SaaS businesses, deferred revenue represents cash collected upfront before service delivery. When growth moderates, previously collected deferred revenue is recognized into P&L Net Income each month without generating fresh cash inflows.
Combined with compressed Days Payable Outstanding (DPO)—such as paying vendors faster than necessary—cash drains despite reported profits.
If an interviewer omits essential working capital variables, apply the guidelines in our advisory guide on when you don't know the answer how to handle it gracefully to state reasonable working assumptions before calculating.
6. How to Structure Your Roleplay Responses Under Pressure
When facing an executive case study in your next interview, keep the CLEAR communication framework in mind:
- Clarify Scope: Restate key variables (useful life, financing mix, tax rates, period). Confirm whether the interviewer wants accounting impacts, commercial recommendations, or both.
- Lay the Accounting Foundation: State primary statement linkages out loud before calculating arithmetic.
- Execute the Numbers: Walk through financial impacts methodically—Income Statement first, Cash Flow Statement second, Balance Sheet third. Complete the balance check: Assets = Liabilities + Equity.
- Analyze Variance Drivers: Isolate Price, Volume, Mix, and Cost factors rather than aggregating changes into a generic bucket.
- Recommend Actionable Next Steps: Conclude as an operational business partner. Offer management recommendations, risk mitigations, and forward-looking sensitivity scenarios.
Treating the interview as a strategic boardroom collaboration positions you as a trusted financial advisor who helps leadership steer the company.
Frequently Asked Questions
What is the most common mistake candidates make in three-statement interview questions?
The most frequent error is neglecting the tax shield on non-cash expenses. When depreciation rises by $10, Net Income drops by $10 * (1 - Tax Rate). With a 20% tax rate, Net Income drops by $8. Adding back $10 non-cash depreciation on the Cash Flow Statement yields a +$2 net cash impact. Candidates who overlook this fail the final balance check.
How does Stock-Based Compensation (SBC) impact the three statements?
SBC is recognized as an operating expense on the Income Statement, reducing Net Income (shielded by tax if deductible). On the CFS, SBC is added back under Operating Cash Flow as a non-cash item. On the Balance Sheet, cash increases by tax savings, Retained Earnings falls by Net Income, and APIC increases by the SBC amount, maintaining equilibrium.
How do I prepare for FP&A case studies if I come from an audit or accounting background?
Accountants often have strong technical balance sheet skills but struggle with commercial storytelling. To bridge this, practice articulating why variances occur and how operational bottlenecks impact cash runway. Review real-world corporate finance interview questions and participate in interactive AI mock sessions to build fluency.
Accelerate Your Finance Interview Preparation
Mastering financial modeling mechanics and variance decomposition requires deliberate, out-loud practice under timed interview conditions.
- Test Your Speed: Take our free 60-Second Job Blitz to test your technical finance recall, working capital diagnostic reflexes, and valuation intuition with rapid-fire questions.
- Master Complex Scenarios: Explore our full suite of AI-powered persona mock interviews and customized roleplay modules on our Pricing Plans page to practice real-time executive case studies tailored to senior corporate finance and FP&A roles.
Practice FP&A Manager Questions Live with AI Mock Interviews
Turn any job description across Engineering, DevOps, Data, Marketing, Sales, Finance, or HR into a personalized test and live voice or text AI mock interview on totop.app, or test your speed right now in the 60-Second FP&A Manager Blitz.
Play 60s FP&A Manager Blitz (Free, No Login) | Start 14-Day Free Trial | Browse All Interview Guides