FP&A Analyst Interview Questions: The Strategic Prep Guide
Financial Planning & Analysis (FP&A) has transformed into the primary nervous system of modern corporate strategy. Gone are the days when financial analysts sat in back-office cubicles crunching historical journal entries and pasting static charts into slide decks. Today, high-growth technology startups and Fortune 500 enterprises alike look at the FP&A team as strategic co-pilots to the CFO and executive committee.
When finance directors and VP of Finance leaders interview candidates, they rarely fail someone because they forgot an obscure spreadsheet shortcut. They reject candidates who cannot translate raw numbers into actionable business narratives. They are testing whether you understand unit economics, driver-based forecasting, margin degradation, and cross-functional business partnering.
Whether you are targeting an Associate FP&A Analyst, Senior Corporate Finance Analyst, or FP&A Manager position, this comprehensive guide provides the core fpa analyst interview questions, quantitative frameworks, and real-world executive answers you need to stand out.
Part 1: The Modern FP&A Operating Rhythm
Before diving into specific questions, you must demonstrate a firm grasp of the corporate finance cadence. An outstanding FP&A professional does not view budgets as one-time annual events; they manage an interconnected, iterative cycle of strategic capital allocation.
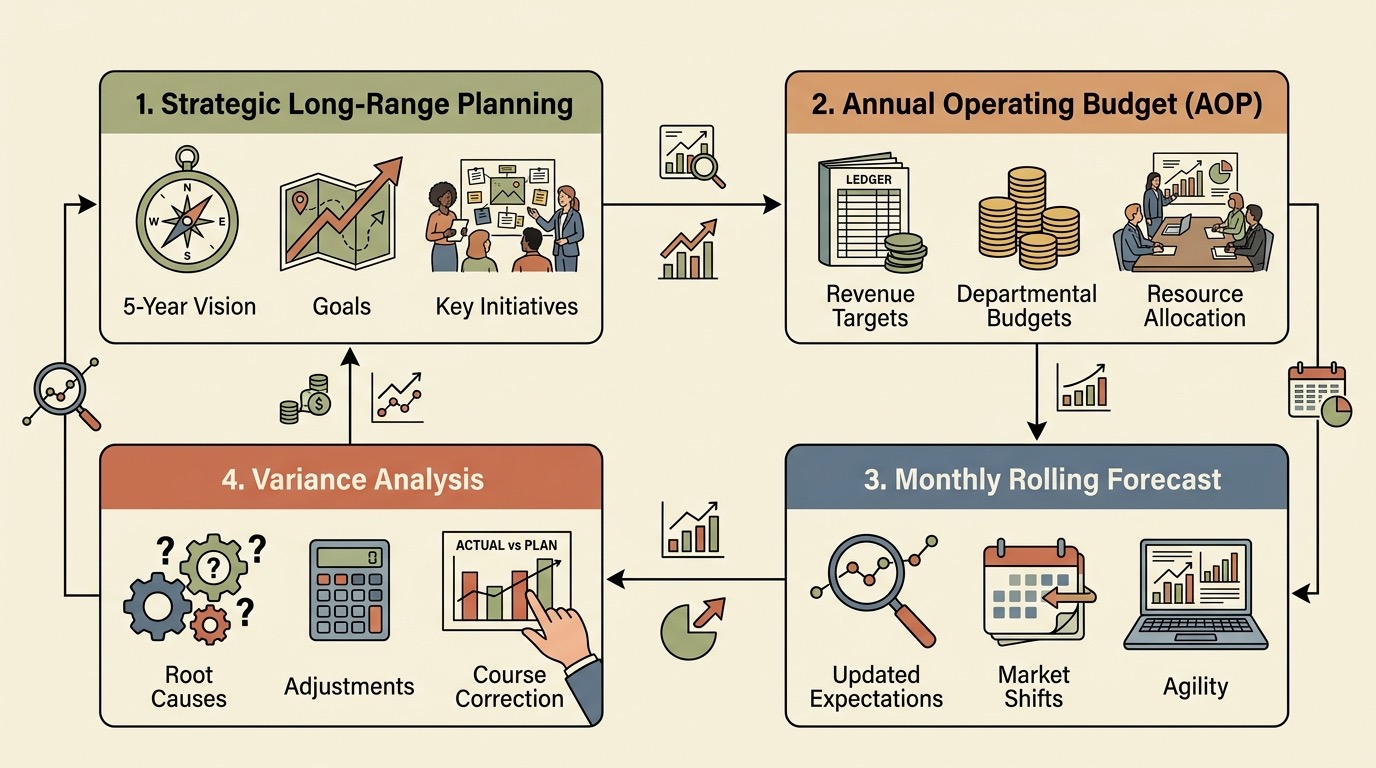
The four foundational pillars of this operating rhythm include:
- Strategic Long-Range Planning (LRP): Establishing the three- to five-year strategic vision, capital expenditure roadmaps, debt structure milestones, and high-level enterprise goals alongside the board of directors.
- Annual Operating Budget (AOP): Translating long-term goals into detailed departmental budget allocations, headcount requisition schedules, and operating expense targets for the upcoming fiscal year.
- Monthly & Quarterly Rolling Forecasts: Updating full-year financial expectations monthly based on actual performance, shifting market dynamics, hiring velocity, and pipeline conversion rates.
- Variance Analysis & Course Correction: Analyzing the delta between Actual vs. Budget (A vs. B) and Actual vs. Forecast (A vs. F), isolating underlying business drivers, and collaborating with business leaders on corrective action.
Candidates who frame their technical answers within this continuous operating rhythm instantly show maturity beyond traditional accounting backgrounds.
Part 2: Technical & Quantitative FP&A Interview Questions
Interviewers test your technical competency by evaluating how you think about three-statement integration, variance decomposition, and forecasting models.
Question 1: How do you dissect a Revenue Variance into Price, Volume, and Mix?
What the Interviewer Is Testing:
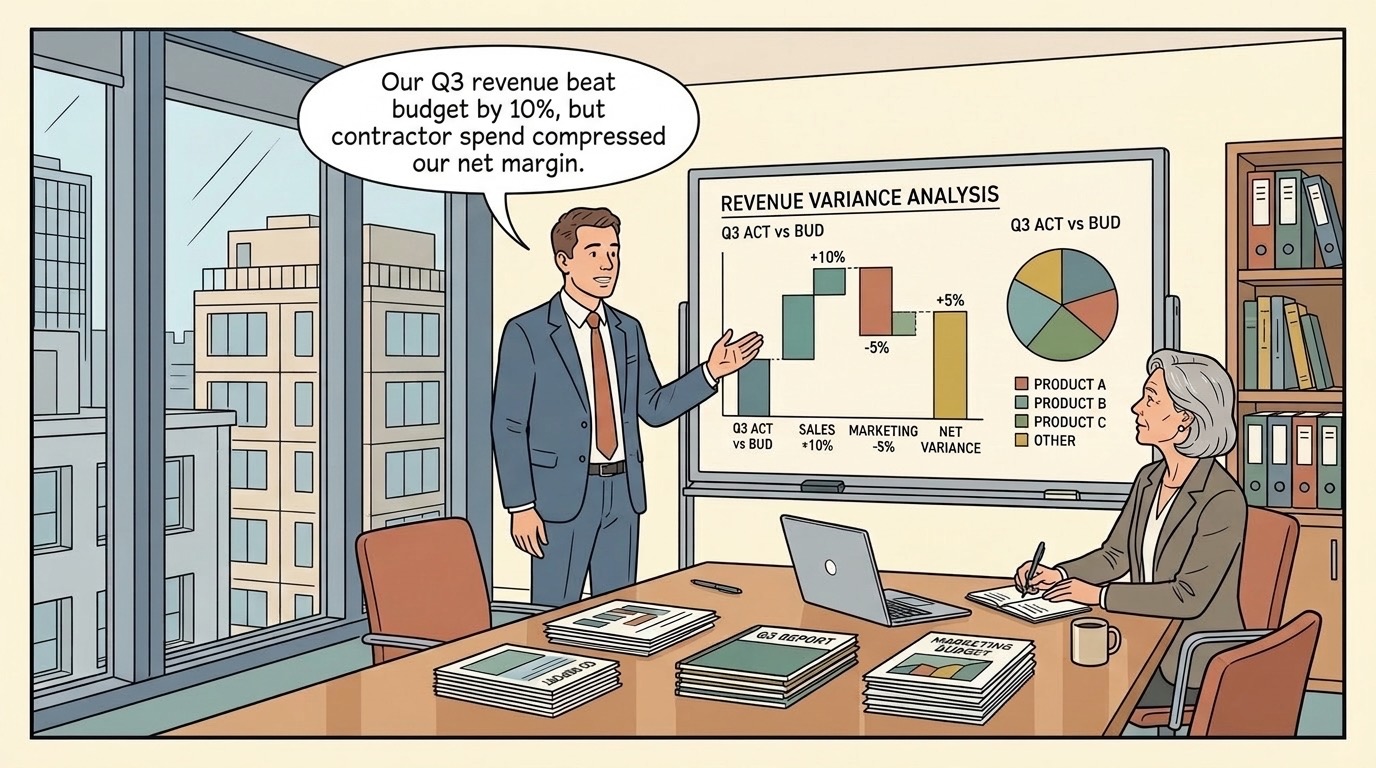
Variance analysis is the bread and butter of corporate finance. A junior analyst simply reports: "Revenue beat target by How to Structure Your Answer:
Explain the mechanical bridge before illustrating the strategic interpretation: Sample Answer: "When presenting our monthly variance to leadership, I never present a top-line dollar delta in isolation. For example, if subscription revenue is $500,000 above plan, I build a waterfall bridge isolating price, volume, and mix. If volume grew by 15% but our price variance was negative due to heavy end-of-quarter enterprise discounting, that represents an operational risk: our sales velocity is increasing, but our unit economics are eroding. Breaking down price, volume, and mix gives executive leadership the exact levers to either correct sales discount approvals or double down on high-margin product packaging." If you want to practice explaining complex financial mechanics under pressure, review our foundational breakdown on three-statement financial analyst interview questions to sharpen your balance sheet linkages. What the Interviewer Is Testing:
Traditional accounting relies on run-rate extrapolation (taking last quarter's spend and adding 3%). Modern FP&A relies on driver-based modeling—linking financial outputs directly to operational inputs and business activity. Key Drivers to Highlight: Sample Answer: "Driver-based forecasting anchors every financial line item to operational milestones. For engineering and sales headcount—which typically represents 65% to 75% of an enterprise SaaS budget—I model hiring schedules rather than static headcounts. Each open requisition is assigned a target start date, an average recruiting lag (e.g., 45 days), and a fully burdened cost multiplier. For sales teams, revenue output is tied to AE ramp curves and attrition rates. If talent acquisition slips on hiring engineering pods by three weeks, the model automatically shifts both capitalized software development costs and operating cash burn into future quarters." What the Interviewer Is Testing:
The P&L measures profitability, but cash flow dictates corporate survival. A company can be GAAP profitable while running out of liquidity due to delayed accounts receivable collections or capital expenditure timing. How to Explain the Structure:
A 13-week forecast (one calendar quarter) is managed strictly on a direct cash receipts and cash disbursements basis: Strategic Nuance to Emphasize: "A 13-week model operates as a direct liquidity instrument, updated every Monday morning. Unlike our full-year indirect cash flow statement, the 13-week forecast tracks invoice aging and cash conversion cycles in real time. If DSO (Days Sales Outstanding) expands from 42 days to 58 days because enterprise customers are delaying approvals, the 13-week model flags the cash trough four weeks before it impacts working capital, giving treasury and finance teams time to optimize payments or draw on revolving credit lines." What the Interviewer Is Testing:
Understanding ASC 350-40 (Internal-Use Software) is essential for corporate finance and FP&A analysts in software-driven organizations. Your accounting choices directly influence EBITDA and cash flow reporting. The Criteria: Strategic Impact: "Capitalizing internal-use software development increases current-period EBITDA and operating margin because engineering salaries are moved off the P&L and onto the balance sheet as intangible assets. However, it does not alter cash flow—the cash out the door for payroll is identical. In FP&A, I track both GAAP EBITDA and Cash EBITDA (deducting capitalized software) so management clearly understands our genuine underlying burn rate." FP&A is 40% analytical modeling and 60% relationship diplomacy. These questions assess whether you can influence executive decisions and defend financial discipline without alienating department heads. What the Interviewer Is Testing:
Can you maintain analytical objectivity under organizational pressure without becoming dogmatic or combative? The Recommended Response Framework: Sample Answer: *"I never frame budget discussions as 'FP&A vs. Sales.' I sit down with the VP of Sales and examine the pipeline metrics together. I pull our historical conversion rates across lead tiers over the last six quarters: average sales cycle length, win rates by deal size, and stage-gate progression. If they believe upcoming product features will boost conversion from 18% to 26%, I celebrate that ambition, but explain the downside risk: inflating our baseline budget forces higher hiring and marketing spend before the cash arrives. Instead of a contentious standoff, I propose a dynamic contingency model: we establish our baseline budget at historical conversion benchmarks, and create a funded accelerator trigger. If stage-2 pipeline hits 120% of goal by month two, we automatically unlock their secondary hiring budget. This protects enterprise runway while fully rewarding sales performance."* If you encounter unexpected pushback during tough executive interviews, our guide on handling tricky questions gracefully provides excellent tactics for pausing, reframing, and maintaining composure. What the Interviewer Is Testing:
Do you jump straight to accusing colleagues of overspending, or do you analytically diagnose the variance root cause? Evaluation Steps: Sample Answer: *"When a department displays an unfavorable OpEx variance, my first step is verifying the GL ledger entries with accounting. In many cases, it is a timing anomaly—such as prepaid software annual billing hitting in month two rather than amortizing monthly. If the overage is permanent, I schedule an informal 15-minute sync with the department head before alerting the CFO. I walk through the variance bridge together: 'We noticed contractor spend is running $40,000 above plan.' Often, they reveal a valid operational blocker, such as covering for a key employee on leave. Once we understand the root cause, we partner on an offset plan—identifying unallocated software licenses or discretionary travel budgets we can pause to bring the department back in line before quarter-end."* For cross-functional behavioral comparisons, see our guide on HR business partner interview questions to understand how People Operations and Finance intersect on organizational restructuring. When an interviewer asks you an open-ended financial case question—such as "Walk me through how you would evaluate an acquisition target" or "How would you present our gross margin compression to the board?"—use the ODIA Framework: Adopting this structured narrative immediately elevates your responses from a rote junior bookkeeper to an executive finance partner. Before stepping into your interview rounds, run through this practical preparation checklist: By combining rigorous financial statement mechanics with empathetic, proactive business partnering, you demonstrate the exact hybrid skillset hiring managers look for in top-tier FP&A talent. Review our comprehensive interview preparation guide to align your overall preparation schedule, and take control of your upcoming interviews with total confidence.
Question 2: What is driver-based forecasting, and how do you build a driver model for SaaS headcount?
Question 3: How do you build a 13-Week Cash Flow Forecast, and why is it critical for liquidity management?
Starting Cash Balance
+ Operating Cash Receipts:
  - Customer Accounts Receivable (A/R) collections (aged by DSO)
  - Upfront annual contract renewals
- Operating Cash Disbursements:
  - Bi-weekly Payroll and Contractor payments
  - Critical vendor software and infrastructure bills (AWS, GCP, Salesforce)
  - Facility leases and utilities
- Financing & Investing Cash Flows:
  - Debt service (principal + interest)
  - Tax distributions and CapEx equipment purchases
= Ending Weekly Cash Balance
- Minimum Liquidity Covenant Threshold
= Net Surplus / Liquidity Shortfall
Question 4: How do you decide whether software development costs should be capitalized (CapEx) or expensed (OpEx)?
Part 3: Strategic Business Partnering & Behavioral Scenarios
Question 5: A VP of Sales insists your pipeline conversion forecast is too pessimistic and demands an increased quota budget. How do you respond?
Question 6: A business unit leader is tracking 15% over their departmental OpEx budget. Walk me through your investigation.
Part 4: The 4-Step Narrative Framework for FP&A Scenarios
Stage Focus Area Example Dialogue 1. Observation State the quantified variance clearly "Gross margin contracted 240 basis points from 74.2% to 71.8%." 2. Decomposition Break down into underlying cost drivers "180 bps was driven by increased cloud hosting usage during peak migrations, and 60 bps was due to tier-2 support contractor overtime." 3. Impact Translate to cash, runway, and enterprise valuation "This contraction reduces annualized free cash flow by $620,000, which lowers our debt covenant headroom." 4. Action Plan Recommend concrete, executable next steps "We worked with DevOps to implement AWS auto-scaling policies, reversing 140 bps of the cloud overrun by next month."
Part 5: Essential Preparation Checklist for FP&A Interviews