In senior data engineering and distributed systems interview loops, hiring managers rarely ask candidates to define basic DataFrame transformations. Instead, they present ambiguous production incidents: "Our nightly 4 TB batch aggregation pipeline fails at stage 14 with java.lang.OutOfMemoryError: Java heap space. The job runs smoothly on staging, but worker executors crash under production volume. Walk us through your triage, root-cause isolation, and cluster configuration strategy."
How a candidate deconstructs this prompt distinguishes junior developers from experienced data platform architects. Novices often suggest doubling executor memory or adding more cluster nodes—costly mitigations that fail to fix systemic memory leaks or partition hotspots.
Excelling in the apache spark out of memory tuning interview requires an authoritative mental model of Spark internal memory management, JVM garbage collection, physical execution plans, and shuffle operations. This guide covers the diagnostic frameworks, memory formulas, PySpark tuning techniques, and architectural trade-offs interviewers look for when evaluating senior engineering talent.

The Anatomy of a Distributed Memory Failure in Production
When preparing for an advanced technical interview preparation round, candidates must recognize that an Out of Memory (OOM) error in apache spark is not a single failure mode. Spark is a distributed engine with a central Driver coordinating independent Worker nodes that run Executor JVM processes.
Memory failures manifest across three distinct architectural layers:
- Driver Memory Exhaustion: The driver JVM exhausts its heap while aggregating records, collecting oversized partitions, or building massive query execution plans.
- Executor Heap Exhaustion (
Java heap space): Individual worker tasks exceed allocated space in the Spark execution or storage pools during shuffles, joins, or aggregations. - Container Eviction (YARN / Kubernetes
Exit Code 137): Total physical memory consumed by the executor JVM (heap plus native off-heap memory, Python worker daemons, and OS buffers) breaches container limits. Similar to Kubernetes pod eviction and troubleshooting, the orchestrator forcibly terminates the container via SIGKILL.
Apache Spark Unified Memory Architecture: The Foundational Model
To justify tuning decisions in an interview, candidates must be ready to explain the Apache Spark Unified Memory Manager introduced in Spark 1.6 and used across modern Spark 3.x and 4.x versions.
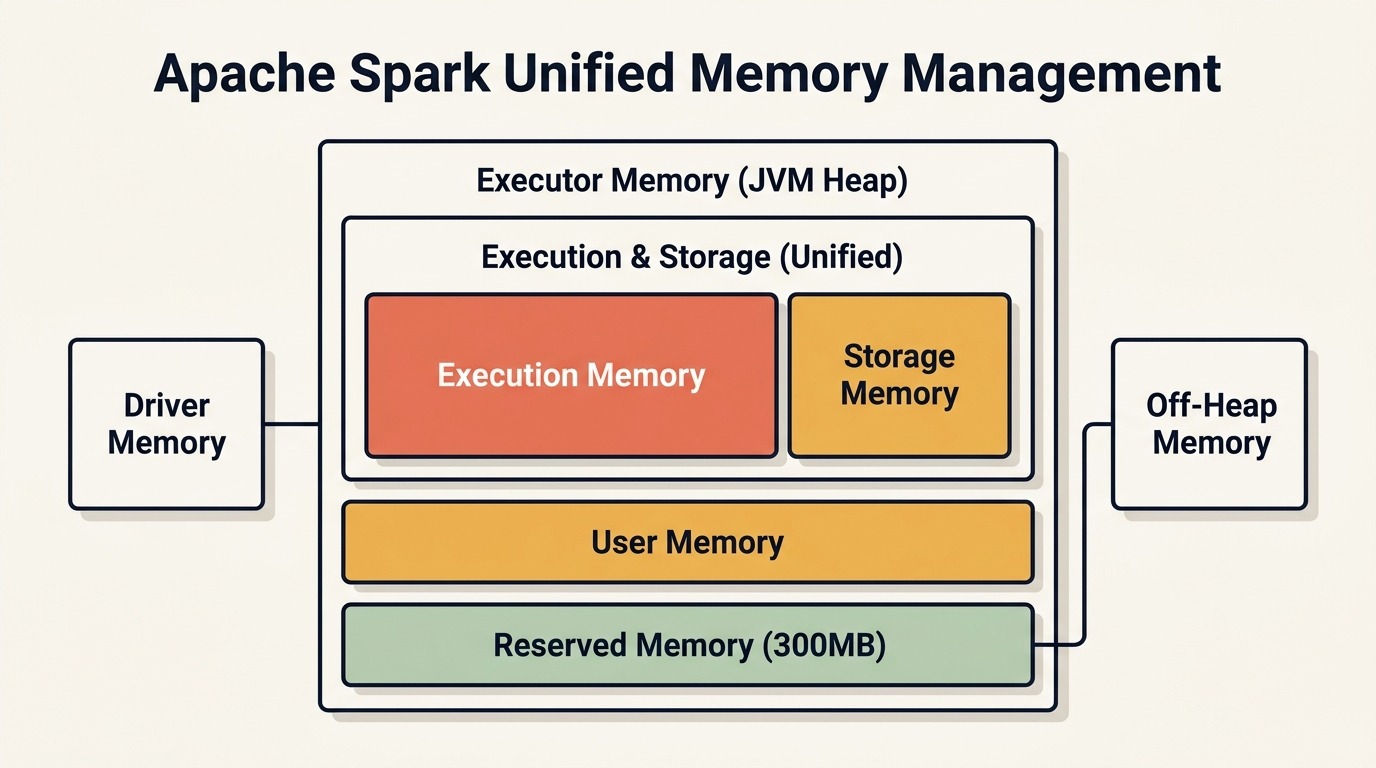
JVM Heap Breakdown: Reserved, User, and Unified Memory
When an executor JVM launches with configured heap memory (spark.executor.memory), Spark divides heap space across four distinct regions:
- Reserved Memory (300 MB): A hardcoded buffer reserved for Spark internal daemons, task execution trackers, and recovery processes. If an executor has under 450 MB total memory, the engine will not start.
- User Memory: Calculated as
(Total Heap - 300MB) * (1.0 - spark.memory.fraction). By default, withspark.memory.fraction = 0.6, User Memory receives 40% of usable heap. This space holds user-defined data structures, custom Spark UDFs, internal metadata, and RDD dependencies. - Spark Memory Pool (Unified Execution and Storage): Calculated as
(Total Heap - 300MB) * spark.memory.fraction(default 60%). This pool manages analytical workloads and dynamically shares space between:- Execution Memory: Used for shuffles, joins, sorts, and aggregations.
- Storage Memory: Used for cached datasets (
.persist(),.cache()) and broadcast variables.
- Storage Fraction Boundary (
spark.memory.storageFraction): Defaults to0.5(50% of the Spark pool). This setting acts as an eviction threshold. When storage is idle, execution memory can borrow up to 100% of the pool. However, execution memory cannot be evicted by storage; cached blocks are instead evicted to disk.
Off-Heap Storage and Container Overhead (Exit Code 137)
Interviewers frequently probe off-heap memory boundaries: "If an executor has 16 GB of memory, why did Kubernetes evict the pod when JVM monitoring showed only 12 GB heap usage?"
The root cause is Off-Heap Memory and Container Overhead:
- Executor Overhead (
spark.executor.memoryOverhead): Spark reserves safety buffers for off-heap allocations, native C/C++ libraries (such as Arrow or compression codecs), thread stacks, and OS page cache. The formula is:
Memory Overhead = max(384 MB, 0.10 × spark.executor.memory)
- PySpark Daemon Footprint: When running Python transformations (non-vectorized PySpark UDFs or RDD operations), data is serialized and transferred via Unix sockets to separate Python worker processes (
pyspark.daemon). These daemons consume host RAM outside the JVM heap. If their footprint pushes total container usage pastspark.executor.memory + spark.executor.memoryOverhead, the cluster orchestrator issues a SIGKILL (Exit Code 137).
Driver OOM vs. Executor OOM: Architectural Diagnosis Matrix
Structuring failure modes into an explicit comparison matrix demonstrates clear analytical ability during a technical screen:
| Diagnostic Dimension | Driver OOM | Executor OOM (JVM Heap) | Container OOMKilled (Exit Code 137) |
|---|---|---|---|
| Error Signature | java.lang.OutOfMemoryError: Java heap space on Driver | java.lang.OutOfMemoryError: Java heap space on Executor | Container killed by YARN for exceeding memory limits / OOMKilled: 137 |
| Primary Root Cause | Over-collecting records, oversized broadcast joins, deep DAG lineage | Data skew, insufficient shuffle partitions, oversized window frames | PySpark worker overhead, excessive off-heap allocations, native memory leaks |
| Spark UI Indicator | Driver timeline terminates; application exits immediately | Straggler tasks, high JVM Garbage Collection (GC) pauses, shuffle spill | Task fails with lost executor; node kernel log records oom-killer invocation |
| Primary Remediation | Replace .collect() with .take(), adjust autoBroadcastJoinThreshold | Salt join keys, increase spark.sql.shuffle.partitions, optimize core ratios | Increase spark.executor.memoryOverhead, rewrite Python UDFs to native SQL |
Driver Out of Memory: Root Causes and Remediation
Interviewers look for candidates who eliminate anti-patterns that destabilize the Driver:
- Unconstrained Actions (
.collect()/.toPandas()): Calling.collect()or converting a distributed dataset to pandas pulls all partition records across all executors over the network into the driver JVM heap. If the dataset exceeds driver heap capacity, an immediate crash occurs. Remediation: Enforce pagination with.take(n), write results directly to cloud storage, or use Delta Lake tables evaluated in our Snowflake vs Databricks data architecture comparison. - Aggressive Broadcast Joins: While broadcast hash joins bypass expensive cluster shuffles by sending the smaller table to all executors, the driver must first collect and serialize that table. If a table exceeds driver memory or
spark.sql.autoBroadcastJoinThreshold(default 10 MB), the driver crashes during serialization. Remediation: Monitor table statistics or disable automatic broadcasting when dimension tables grow unpredictably (SET spark.sql.autoBroadcastJoinThreshold = -1). - Deep Iterative DAG Lineage: Recursive loops or machine learning routines that chain hundreds of transformations inflate the driver query execution graph.
Remediation: Break DAG lineage periodically with
df.checkpoint()or write intermediate checkpoints to distributed storage.
Executor Out of Memory: Root Causes and Remediation
Executor failures represent most distributed pipeline bottlenecks. In technical evaluations, emphasize these core triggers:
- Severe Data Skew: A single skewed partition containing 50% of the dataset forces one executor core to process millions of rows while other cores sit idle, exhausting executor heap during wide transformations.
- Shuffle Spill to Disk: When the execution memory pool fills up during a sort or hash aggregate, Spark writes uncompressed partition records to local worker disks ("Spill (Memory)" vs "Spill (Disk)"). If disk bandwidth saturates or storage fills, the executor fails.
- Excessive Core-to-Memory Concurrency: Allocating too many CPU cores to one executor (e.g.,
spark.executor.cores = 16withspark.executor.memory = 16G) forces 16 concurrent tasks to compete for the same heap. If each task buffers intermediate shuffle data, the executor runs out of memory.
Hands-On Scenario: Debugging Data Skew and Shuffle Spillage
In real-world data engineering scenarios, data skew is the most common cause of executor OOMs. Below is a diagnostic walkthrough demonstrating how a senior engineer resolves skew during an interview.
Diagnosing Partition Skew with PySpark Telemetry
When an interviewer asks how to verify data skew using metrics rather than guesswork, describe the Spark Web UI Stage Details:
- Task Duration Metrics: Min and Median task durations are around 15 seconds, while Max task duration is 35 minutes.
- Shuffle Read Size Distribution: 199 tasks process 20 MB each, while task #14 processes 18 GB.
- Garbage Collection (GC) Time: Task #14 spends over 50% of its runtime in stop-the-world JVM GC pauses.
In PySpark code, partition distribution can be inspected directly:
from pyspark.sql import functions as F

# Inspect record distribution across physical partitions
partition_counts = (
    df.withColumn("partition_id", F.spark_partition_id())
    .groupBy("partition_id")
    .count()
    .orderBy(F.desc("count"))
)

partition_counts.show(10)
Mitigating Skew: Two-Phase Salting Technique
When joining a massive fact table against a dimension table on a skewed key (e.g., tenant_id = 'DEFAULT'), standard hash partitioning routes all 'DEFAULT' rows to a single reducer. The robust solution is salting.
Salting distributes the skewed key across N synthetic sub-keys, performs a distributed join, and eliminates partition hotspots:
from pyspark.sql import functions as F

SALT_ROUNDS = 8

# Step 1: Add a pseudo-random salt integer (0 to 7) to the skewed large dataset
fact_salted = fact_df.withColumn(
    "salt",
    F.floor(F.rand() * SALT_ROUNDS)
).withColumn(
    "salted_join_key",
    F.concat(F.col("tenant_id"), F.lit("_"), F.col("salt"))
)

# Step 2: Replicate the lookup dimension table across all salt values
dim_replicated = (
    dim_df.withColumn("salt_array", F.array([F.lit(i) for i in range(SALT_ROUNDS)]))
    .withColumn("salt", F.explode("salt_array"))
    .withColumn(
        "salted_join_key",
        F.concat(F.col("tenant_id"), F.lit("_"), F.col("salt"))
    )
    .drop("salt_array", "salt")
)

# Step 3: Perform balanced hash join on the salted key without memory hotspots
balanced_joined_df = fact_salted.join(
    dim_replicated,
    on="salted_join_key",
    how="inner"
).drop("salted_join_key", "salt")
This technique ensures work is evenly balanced across all worker executors. These patterns regularly appear in general data engineering interview questions and targeted SQL interview questions for data engineers.
Leveraging Adaptive Query Execution (AQE) in Modern Spark
Candidates preparing for modern technical interviews must also discuss Spark 3.x+ native optimizations:
- Automatic Skew Join (
spark.sql.adaptive.skewJoin.enabled = true): Spark dynamically detects partition skew at runtime usingspark.sql.adaptive.skewJoin.skewedPartitionFactor(default 5) andspark.sql.adaptive.skewJoin.skewedPartitionThresholdInBytes(default 256 MB), automatically splitting oversized partitions into smaller sub-partitions. - Dynamic Partition Coalescing (
spark.sql.adaptive.coalescePartitions.enabled = true): Automatically consolidates small post-shuffle partitions to prevent the driver from managing tens of thousands of tiny tasks.
Production Memory Configuration Playbook for Distributed Clusters
When asked to size and tune a cluster for memory-heavy workloads, presenting a battle-tested configuration template establishes operational credibility:
# Recommended production spark-submit configuration for memory-heavy workloads
spark-submit \
  --master k8s://https://k8s-apiserver:443 \
  --deploy-mode cluster \
  --driver-memory 8g \
  --driver-cores 4 \
  --num-executors 20 \
  --executor-memory 24g \
  --executor-cores 4 \
  --conf spark.executor.memoryOverhead=4g \
  --conf spark.memory.fraction=0.7 \
  --conf spark.memory.storageFraction=0.3 \
  --conf spark.sql.shuffle.partitions=800 \
  --conf spark.sql.adaptive.enabled=true \
  --conf spark.sql.adaptive.skewJoin.enabled=true \
  --conf spark.serializer=org.apache.spark.serializer.KryoSerializer
The Three Golden Rules of Executor Sizing:
- Never allocate more than 5 cores per executor: Setting
spark.executor.cores > 5creates thread contention and causes severe HDFS/object-storage I/O bottlenecks. Keep executor cores between 3 and 5 for optimal JVM throughput. - Cap executor heap below 32 GB: JVM garbage collection pause times scale non-linearly with heap size. A 64 GB heap can trigger 30-second stop-the-world GC pauses that cause the cluster manager to suspect executor death. Running four 16 GB executors is significantly more reliable than running two 32 GB executors.
- Apply the 10% Overhead Rule: Ensure
spark.executor.memoryOverheadprovides at least 15–20% ofspark.executor.memoryfor heavy PySpark or Arrow workloads to prevent container eviction by Kubernetes or YARN.
Senior vs. Staff Data Engineer Evaluation Rubric
Engineering interview panels use specific competencies to differentiate mid-level, senior, and staff-level candidates during distributed systems rounds:
| Evaluation Dimension | Mid-Level Engineer (L4) | Senior Data Engineer (L5) | Staff / Principal Architect (L6) |
|---|---|---|---|
| Problem Diagnosis | Suggests increasing cluster RAM or restarting failed tasks. | Inspects Spark UI metrics, identifies shuffle spill, task duration outliers, and data skew. | Identifies systemic data model defects, optimizes upstream partitioning, and automates AQE tuning. |
| Memory Mechanics | Knows executors have heap space; unaware of off-heap boundaries. | Diagrams Unified Memory Manager (Execution vs. Storage vs. User Memory). | Analyzes OS page cache, off-heap Arrow memory, JVM GC collector trade-offs (G1GC vs ParallelGC). |
| Skew Remediation | Attempts manual filtering or increases partition count arbitrarily. | Implements key salting, broadcast thresholds, and map-side aggregations. | Re-architects upstream data contracts, designs composite partition keys, and minimizes wide dependencies. |
| Cost & Reliability | Focuses only on making the job pass; ignores cluster compute costs. | Optimizes core-to-memory ratios to balance throughput and cloud spending. | Establishes cluster-wide multi-tenant governance, spot instance resilience, and platform SLA monitoring. |
Preparing for Distributed Systems & Data Engineering Interviews
Mastering distributed compute optimization requires moving beyond passive reading into active, high-pressure interview practice. In live technical interviews, hiring managers probe your instincts by dynamically changing constraints—doubling dataset sizes, cutting compute budgets, or asking you to evaluate distributed messaging architectures like Kafka vs RabbitMQ system design.
To test your readiness under real interview conditions, explore our interactive prep tools:
- Test your core technical instincts in real time with our rapid-fire 60-Second Job Blitz to evaluate how well you handle unexpected production scenarios without hesitation.
- Ready to simulate complete technical deep-dives with AI hiring managers tailored to your target company's architecture? Explore totop.app pricing and start your comprehensive interview preparation today.
Practice Staff Backend Engineer Questions Live with AI Mock Interviews
Turn any job description across Engineering, DevOps, Data, Marketing, Sales, Finance, or HR into a personalized test and live voice or text AI mock interview on totop.app, or test your speed right now in the 60-Second Staff Backend Engineer Blitz.
Play 60s Staff Backend Engineer Blitz (Free, No Login) | Start 14-Day Free Trial | Browse All Interview Guides