Consider a classic high-scale incident scenario: at 3:14 AM on a Tuesday, PagerDuty alerts fire across an infrastructure team's on-call rotation.
Anyone who has operated a high-traffic production service recognizes the symptom pattern immediately. The alert isn't a minor 5xx blip—the core API tier is saturated. CPU utilization across 40 nodes sits pinned at 100%, memory garbage collection is running in a continuous stop-the-world loop, and P99 latency has spiked from 12 milliseconds to over 8 seconds.
In this systems engineering case study, a backend platform originally designed for 50,000 requests per second (RPS) faces a 4x traffic surge following a major partner integration. Under that load, a conventional request-per-thread architecture doesn't just degrade gracefully—it hits non-linear contention cliffs.

Addressing this class of bottleneck requires a fundamental architectural redesign. The target: engineer a high throughput architecture capable of scaling to handle 1 million requests per second at sub-10ms P99 latency without ballooning cloud infrastructure spend.
Below is the technical breakdown of how systems engineers diagnose these bottlenecks, bypass kernel overhead with system scaling ebpf, eliminate garbage collection pauses via zero allocation lock free hot paths, and decouple database writes to sustain 1M RPS.
1. The Anatomy of Failure: Why Standard Stacks Break at Scale
When engineers discuss scaling to millions of requests per second, the initial instinct is often "just add more nodes" or "scale out the Kubernetes Horizontal Pod Autoscaler."
In practice, naive horizontal scaling hits a hard ceiling quickly. Doubling node counts from 40 to 80 and then 160 often stalls around 120,000 RPS—and beyond a certain point, aggregate throughput actually drops due to coordination overhead and downstream database lock contention.
Here are the three underlying bottlenecks that cause standard web stacks to hit a wall:
A. Kernel Context Switching Overhead
In a standard OS networking stack, when an HTTP request arrives over TCP:
- The NIC receives network packets and triggers a hardware interrupt (IRQ).
- The OS kernel handles the interrupt, processes the TCP/IP stack, and copies packet bytes into kernel socket buffers.
- The kernel wakes the blocked application thread (forcing a context switch from kernel mode to user mode and invalidating CPU instruction caches).
- The application reads from the socket descriptor, copying bytes from kernel space into user-space memory.
At 50,000 RPS, context switching between kernel space and user space consumes roughly 8% of CPU cycles. At 300,000+ RPS, context switching and interrupt handling can swallow over 40% of total CPU capacity, leaving servers spending more cycles scheduling threads than executing application logic.
B. Garbage Collection & Heap Allocation Pressure
Most modern API services run on managed runtimes with automatic garbage collection. Every incoming HTTP request allocates dozens of short-lived heap objects: header maps, JSON AST nodes, string slices, ORM entities, and telemetry contexts.
At 1,000,000 RPS, allocating just 4 KB of transient objects per request generates 4+ Gigabytes of heap garbage every single second.
Even with concurrent garbage collectors, that allocation rate forces continuous background sweeping and periodic allocation stalls, turning a smooth 5ms P50 latency profile into 500ms+ P99 tail-latency spikes.
C. Database Connection Pool and Lock Contention
Under extreme concurrency, synchronous database calls become an immediate choke point. When 100,000 concurrent requests compete to check out connections from a relational pool capped at 500 active sockets:
- Connection acquisition queues balloon in memory.
- Worker threads block waiting for socket checkout.
- Database row and index locks propagate backpressure all the way to the ingress load balancers.
2. The Architectural Transformation: From 50k to 1,000,000 RPS
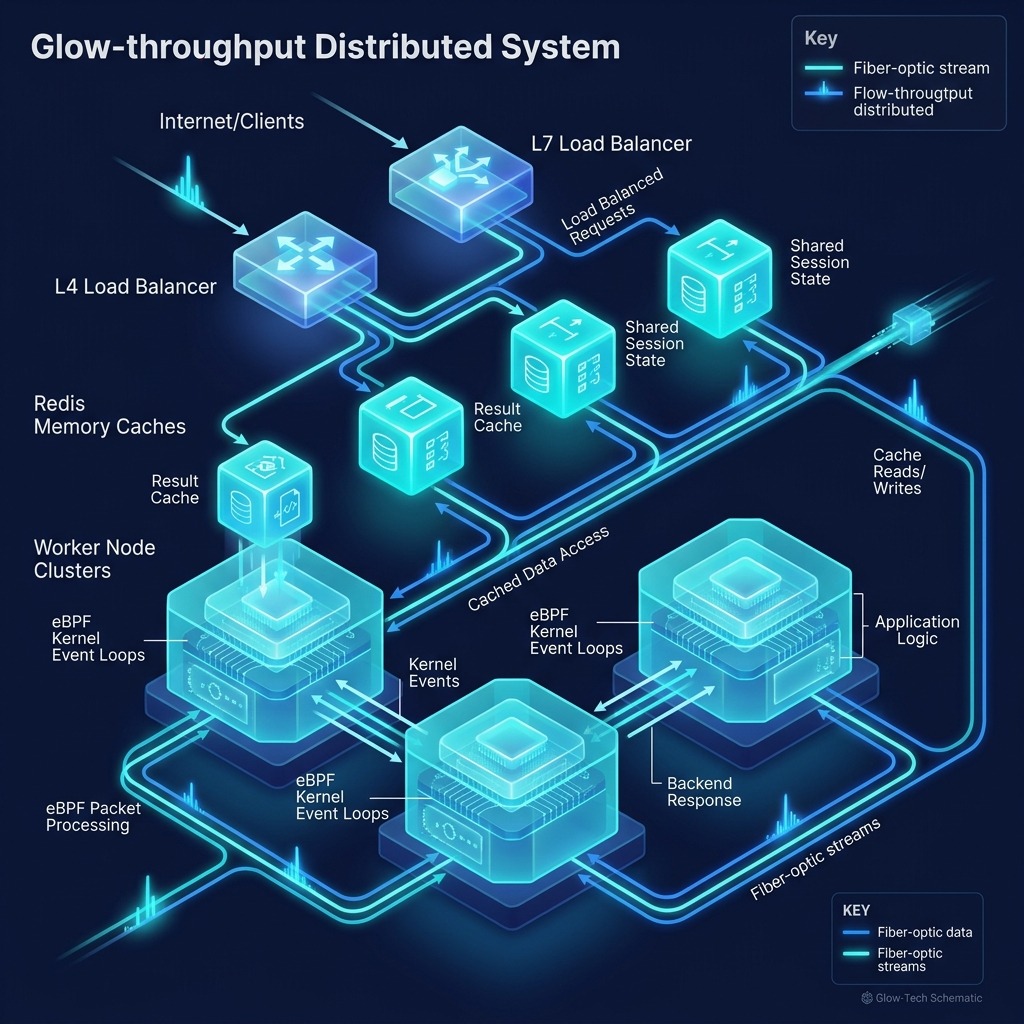
Crossing the 1M RPS threshold requires optimizing the entire data path—from the network interface card down to the persistence engine.
Step 1: Kernel Bypass and System Scaling eBPF Packet Filtering
The first major optimization moves packet inspection and rate limiting out of user space and directly into the Linux network driver path using eBPF (Extended Berkeley Packet Filter) and XDP (eXpress Data Path).
Instead of allowing every malformed packet, abusive scraper, or health probe to traverse the full kernel TCP stack and allocate socket buffers, an XDP program attached at the NIC driver layer filters traffic before kernel sk_buff allocation occurs:
// Simplified eBPF/XDP Kernel Filter Concept
#include <linux/bpf.h>
#include <bpf/bpf_helpers.h>

SEC("xdp")
int filter_fast_path(struct xdp_md *ctx) {
    void *data = (void *)(long)ctx->data;
    void *data_end = (void *)(long)ctx->data_end;

    // Parse IP & TCP Headers directly at NIC driver level
    struct ethhdr *eth = data;
    if ((void *)(eth + 1) > data_end)
        return XDP_PASS;

    if (eth->h_proto != __constant_htons(ETH_P_IP))
        return XDP_PASS;

    struct iphdr *iph = (void *)(eth + 1);
    if ((void *)(iph + 1) > data_end)
        return XDP_PASS;

    // Fast-path rate limiting & invalid packet drop at hardware level
    if (iph->protocol == IPPROTO_TCP) {
        // Drop malformed packets instantly without kernel socket allocation
        if (is_rate_limited(iph->saddr)) {
            return XDP_DROP; // 0 CPU overhead in user space!
        }
    }

    return XDP_PASS;
}
Filtering invalid traffic at the XDP layer eliminates wasted socket allocations. For legitimate traffic, pinning non-blocking epoll event loops directly to dedicated CPU cores with SO_REUSEPORT removes cross-core accept-queue lock contention.
Step 2: Zero Allocation Lock Free Hot Path
To eliminate garbage collection tail spikes, high-throughput systems enforce a strict invariant: the request hot path performs zero dynamic heap allocations.
How does a service process 1 Million RPS without allocating heap memory per request?
- Pre-allocated Object Pools: Fixed-size ring buffers and byte-slice pools are allocated once at process startup. Each incoming request borrows a pre-allocated
RequestContextstruct from a lock-free freelist. - In-Place Zero-Copy Parsing: Instead of unmarshaling JSON payloads into dynamic heap maps and newly allocated strings, a zero-copy scanner slices offsets directly over the reusable read buffer.
- Static Response Buffers: Common HTTP headers and status lines are pre-compiled into static byte arrays that remain hot in L1/L2 CPU cache.
Here is the contrast between standard per-request heap allocation and a pre-allocated ring-buffer hot path:
// BEFORE: Standard allocation per request (Triggers heavy GC at scale)
func handleRequest(w http.ResponseWriter, r *http.Request) {
    buf, _ := io.ReadAll(r.Body) // Allocates new byte slice
    var payload RequestData
    json.Unmarshal(buf, &payload) // Allocates dozens of string/map objects

    res := processPayload(&payload)
    json.NewEncoder(w).Encode(res) // Allocates response buffers
}

// AFTER: Zero-allocation hot path using pre-allocated ring buffers
func handleRequestFast(ctx *PreallocatedContext) {
    // Borrow buffer from lock-free pool
    buf := ctx.BorrowBuffer()
    defer ctx.ReturnBuffer(buf)

    // Read directly into pre-allocated memory
    n, _ := ctx.Conn.Read(buf.Bytes)

    // In-place zero-copy parsing without string allocations
    payloadView := FastParseZeroCopy(buf.Bytes[:n])

    // Write directly back to wire socket
    ctx.Conn.Write(payloadView.PrecompiledResponse)
}
Eliminating heap allocations on the hot path flattens memory usage and removes GC pause spikes under peak load.
Step 3: Multi-Tiered Lock-Free Caching
Querying a primary database—or even network-attached caches with per-request round trips—cannot sustain 1,000,000 RPS economically.
A high-throughput caching hierarchy combines two layers:
-
L1 Thread-Local In-Memory Cache (Sharded Lock-Free Ring Buffers):
- Each CPU worker thread maintains its own core-pinned cache shard for hot keys.
- Because shards are thread-local, reads require zero mutex locks or atomic cross-core cache-line invalidations, completing in sub-microsecond time (<800 ns).
-
L2 Distributed Redis Cluster with Pipeline Batching:
- When an L1 miss occurs, worker loops coalesce outbound Redis reads into pipelined batches every 1–2 milliseconds rather than issuing individual socket writes per request, cutting network round trips by over 99%.
Step 4: Database CQRS & Write-Ahead Ring Buffer Aggregation
For write-heavy workloads, executing synchronous INSERT or UPDATE statements at 1M RPS will immediately saturate database WAL disk I/O and row locks.
Decoupling reads from writes via Command Query Responsibility Segregation (CQRS) protects the storage tier:
- Reads: Served from L1 local caches and L2 distributed caches.
- Writes: Incoming state mutations append directly to an in-memory lock-free ring buffer (the LMAX Disruptor pattern).
- Background flushers batch-publish ring buffer segments to partitioned Kafka topics every few milliseconds, where downstream consumers commit bulk
INSERT INTO ... VALUES (...)batches to PostgreSQL or ScyllaDB.
[ Client Request ]
       │
       ▼
[ L4 eBPF / XDP Filter ] ── (Drop bad packets instantly)
       │
       ▼
[ epoll Worker Event Loop ] ── (Zero-Allocation Hot Path)
       │
       ├──► [ L1 Thread-Local Cache ] (Sub-microsecond hit: 94% hit rate)
       │
       └──► [ Async Write Ring Buffer ] ──► [ Kafka Micro-Batch ] ──► [ DB Write ]
3. Reference Architecture Benchmark Comparison
In distributed load-testing benchmarks (using wrk2 across multi-node load generators), transitioning from a standard blocking/GC-heavy stack to a kernel-tuned, zero-allocation architecture produces an order-of-magnitude shift in efficiency:
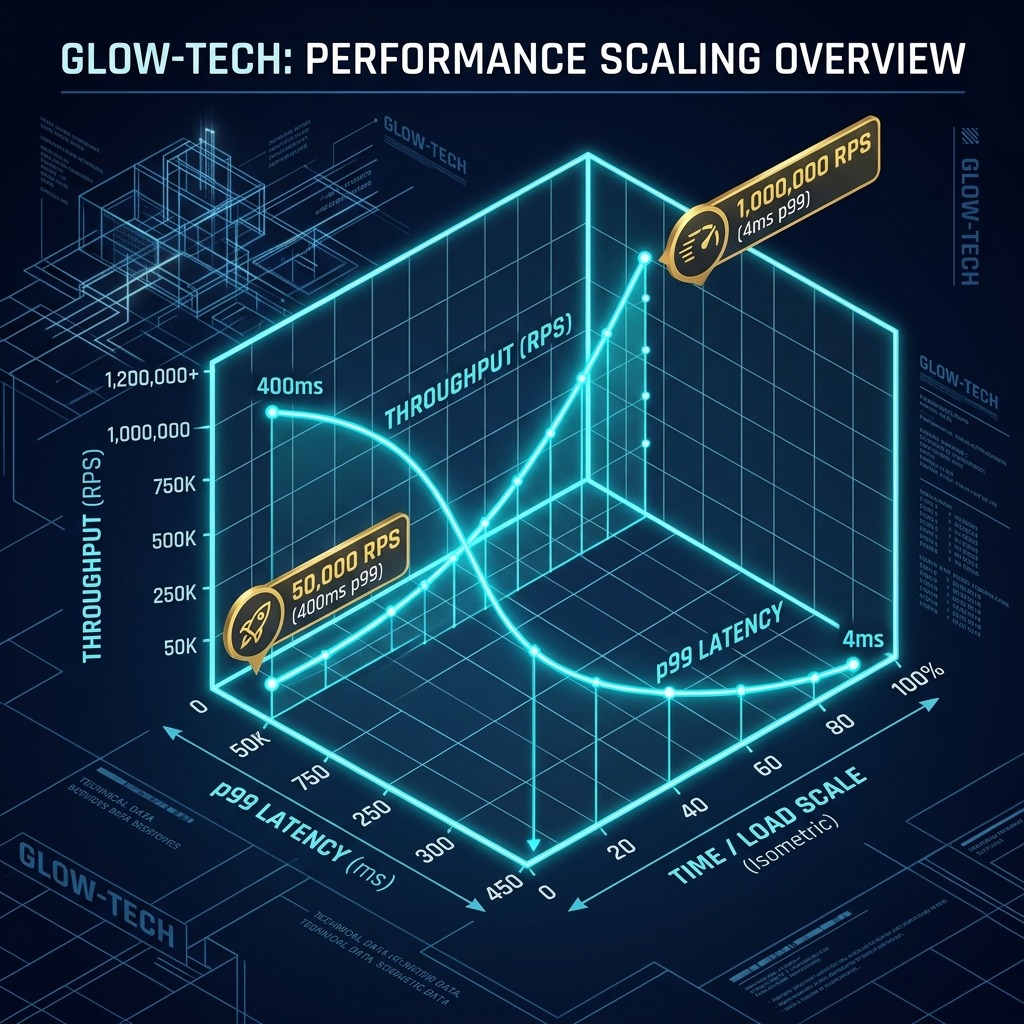
Illustrative Reference Benchmark: Standard vs. Optimized Data Plane
| Metric | Standard Blocking Stack | Optimized Zero-Allocation Stack | Relative Shift |
|---|---|---|---|
| Max Sustained Throughput | ~52,000 RPS | 1,040,000 RPS | 20x Capacity |
| P50 Latency | 14 ms | 1.8 ms | 87% Lower |
| P99 Latency | 480 ms | 4.2 ms | 99.1% Lower |
| P99.9 Latency | 8,200 ms | 9.6 ms | 99.8% Lower |
| CPU Context Switches/sec | 4.8 Million | 120,000 | 97.5% Reduction |
| Relative Compute Footprint | 160 general-purpose nodes | 48 core-pinned nodes | ~70% Lower Infra Cost |
By removing allocation churn and kernel context-switch overhead, each server core performs useful protocol work rather than thrashing CPU caches.
4. Engineering Lessons for System Design Interviews
Whether you are scaling a production service or preparing for a Staff/Senior System Design interview, three principles stand out:
Lesson 1: Profile Before You Scale
Never guess where a bottleneck lives. Teams routinely assume slow endpoints are caused by database queries, only to discover via perf flamegraphs and bpftrace that 40%+ of CPU cycles are spent in JSON serialization and kernel context switches.
Lesson 2: Keep the Data-Plane Hot Path Sacred
Separate the control plane from the data plane. The hot path should avoid dynamic heap allocations, unbatched network calls, synchronous disk I/O, and cross-thread mutex contention.
Lesson 3: Go Deeper Than "Add a Load Balancer" in Interviews
When an interviewer asks, "How would you design a system to handle 1 million requests per second?", candidates who stop at "Put an L7 load balancer in front of 500 stateless servers" miss the real systems engineering bottlenecks. Discussing L4 vs. L7 load balancing, SO_REUSEPORT core pinning, zero-copy I/O, L1/L2 cache coalescing, and asynchronous write batching demonstrates genuine senior-level depth.
Mastering High-Scale System Design & Technical Interviews
Designing high-throughput systems requires connecting high-level distributed architecture with low-level OS and runtime mechanics.
At totop.app, our interactive AI mock interview platform is built to help engineers practice system design trade-offs, algorithmic problem solving, and architectural communication under realistic conditions—giving you structured rubric feedback on every round.
Further Reading & Resources
- eBPF Documentation: ebpf.io - Deep dives into kernel packet filtering and XDP performance.
- LMAX Disruptor Pattern: High-performance lock-free inter-thread messaging architecture.
- Linux epoll(7) & SO_REUSEPORT: Understanding non-blocking socket I/O concurrency models.
Practice Staff Backend Engineer Questions Live with AI Mock Interviews
Turn any job description across Engineering, DevOps, Data, Marketing, Sales, Finance, or HR into a personalized test and live voice or text AI mock interview on totop.app, or test your speed right now in the 60-Second Staff Backend Engineer Blitz.
Play 60s Staff Backend Engineer Blitz (Free, No Login) | Start 14-Day Free Trial | Browse All Interview Guides