Site Reliability Engineer SRE Interview Questions: 2026
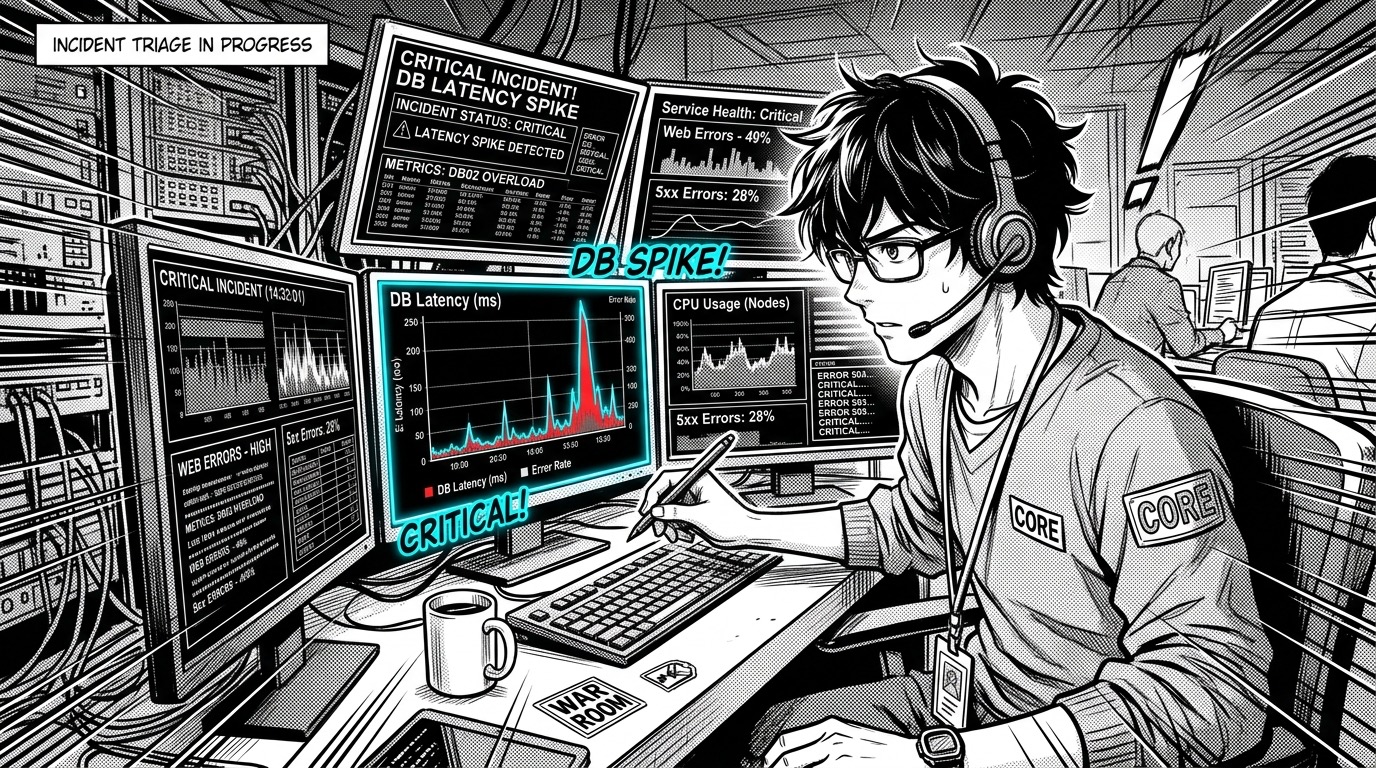
Walking into a Site Reliability Engineering interview is a fundamentally different experience than sitting down for a standard software engineering algorithm test. In a software engineering screen, you solve clean problems with tidy inputs. In an SRE interview, the interviewer hands you a burning system: latency has spiked by 400%, database connection pools are exhausted, automated canary rollouts have stalled, and upstream services are throwing cascading 503 errors.
The interviewers are not just testing whether you have memorized command flags or theoretical distributed systems jargon. They want to observe how your mind operates under pressure. Do you jump to wild conclusions and restart servers blindly, or do you methodically isolate failure domains, formulate testable hypotheses, and mitigate user impact before hunting for root causes?
This comprehensive guide brings together the most critical site reliability engineer interview questions, technical scenarios, and architectural discussions you will encounter in 2026. Whether you are transitioning from traditional DevOps or interviewing for Senior and Staff SRE roles at top tech companies, master these patterns to stand out.
What Interviewers Look for in SRE Candidates
Before diving into code and terminal commands, it is essential to understand the mental model that hiring managers evaluate. While DevOps focuses on accelerating the delivery pipeline from code commit to deployment, Site Reliability Engineering treats operations as a software engineering problem.
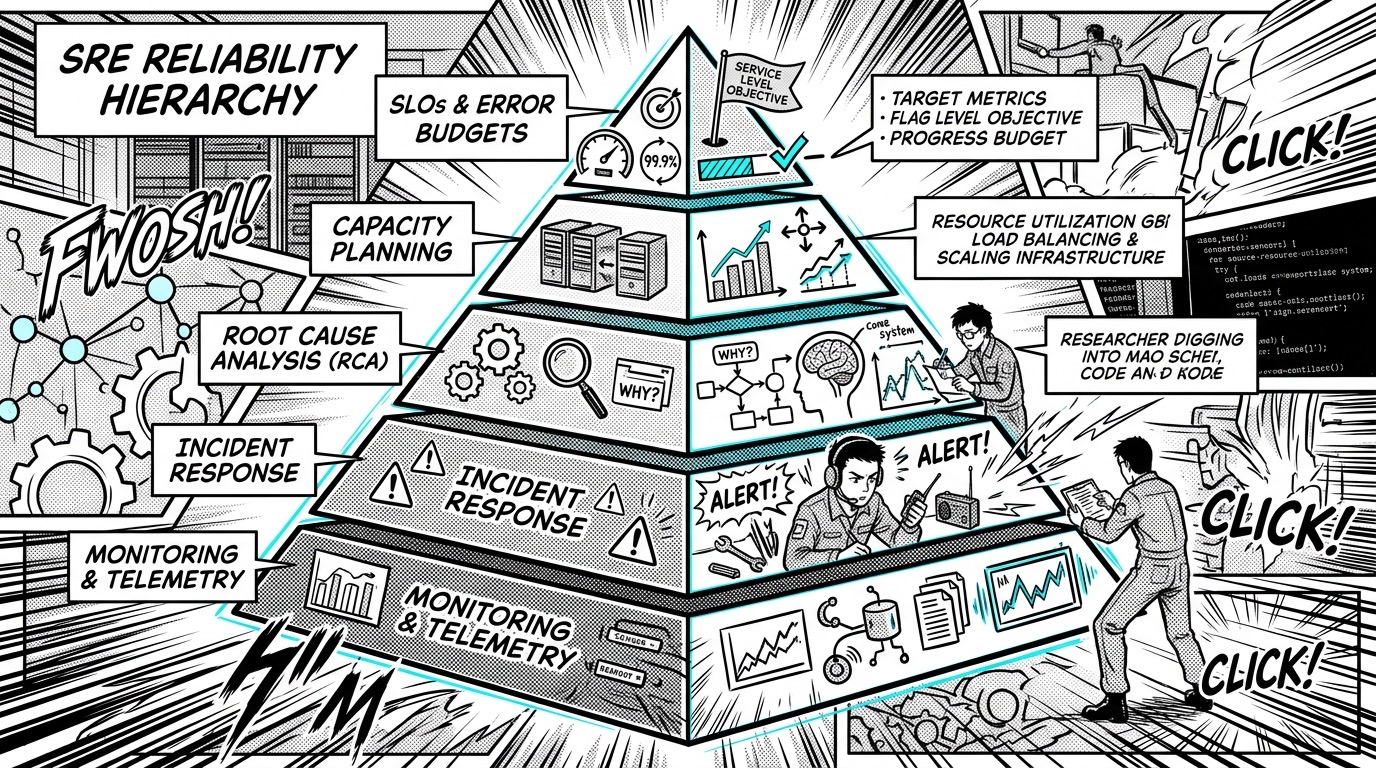
Top engineering organizations evaluate candidates across three foundational pillars:
- Systemic Problem Solving Under Uncertainty: When alerted to a production outage, can you quickly distinguish symptoms from root causes without panicking?
- The Reliability Pyramid: SRE culture builds reliability from the ground up: starting with foundational monitoring and telemetry, progressing to structured incident response, conducting blameless postmortems, planning capacity, and governing release velocity via Service Level Objectives (SLOs).
- Toil Automation: SREs are expected to spend at least 50% of their engineering bandwidth writing code, automating repetitive operational tasks (toil), and building platform guardrails that prevent future outages.
If you are structuring your broader interview preparation roadmap across multiple technical rounds, be sure to reference our complete guide to technical interview prep.
Core Domain 1: Linux Internals and Production Troubleshooting
Systems troubleshooting rounds evaluate how deeply you understand operating system fundamentals, kernel metrics, resource contention, and networking stacks.
Question 1: A production node reports 100% CPU utilization, but top shows no single process consuming significant CPU. How do you diagnose it?
Interviewer Intent: Tests whether you understand CPU metric breakdowns beyond simple %us (user time), including kernel time (%sy), software interrupts (%si), hardware interrupts (%hi), and CPU steal time (%st).
Strong Candidate Answer:
"When total CPU utilization is pegged at 100% but user space processes in top appear idle, the CPU cycles are being consumed by kernel space activities, interrupt handling, or hypervisor throttling.
Here is my structured diagnosis process:
-
Inspect CPU Metric Breakdown: Look at the CPU summary line in
topor runmpstat -P ALL 1:- High
%si(Software Interrupts): Indicates network packet processing storms, high context switching, or interrupt overhead. - High
%sy(System/Kernel Time): Indicates excessive kernel syscalls (e.g., intensive memory allocations, fork bombs, or lock contention in drivers). - High
%wa(I/O Wait): Indicates tasks are waiting on disk or NFS I/O, often accompanied by elevated load averages while actual CPU cores idle. - High
%st(Steal Time): In virtualized cloud environments (AWS EC2, GCP), this reveals hypervisor oversubscription or exhausted burstable CPU credits.
- High
-
Check Short-Lived Ephemeral Processes: If a cron job or faulty microservice is spawning thousands of short-lived sub-processes per second (like a rapid shell loop executing
greporcurl), they may exit beforetopsamples them. I diagnose this by running:# Track process execution in real time execsnoop-bpfcc # Or inspect fork rate via vmstat vmstat 1If the
cs(context switches) or process creation rate is extraordinarily high, short-lived processes are saturating the scheduling queues. -
Inspect Kernel Call Traces: If
%syis dominating, I use Linuxperfto sample running kernel functions:perf topThis immediately highlights if spinlocks, page faults, or network socket allocations are holding the CPU."
Question 2: How do you identify the cause of high disk I/O wait and storage bottlenecks?
Interviewer Intent: Evaluates your familiarity with disk metrics, queue depths, file descriptors, and block storage troubleshooting.
Strong Candidate Answer:
"High %wa indicates that CPU threads are blocked waiting for disk I/O operations to complete. I isolate the bottleneck in four steps:
-
Measure Device Saturation:
iostat -xz 1I examine
%util(percentage of time the device had active requests),await(average time in milliseconds for I/O requests issued to the device to be served), andr/s/w/s(read/write operations per second). If%utilapproaches 100% andawaitspikes into double-digit milliseconds, the storage volume is saturated. -
Pinpoint Culprit Processes:
iotop -oPaThis filters for processes actively issuing disk operations and calculates their cumulative read/write throughput.
-
Check Open File Handles and Deleted Files: Sometimes a disk fills up because a long-running process holds open an unlinked log file. Running
df -hshows 100% capacity, whiledu -sh /reports plenty of free space:lsof +L1This reveals processes holding deleted file descriptors, which can be safely restarted or rotated.
-
Verify Inode Exhaustion: A common production incident occurs when storage has gigabytes of remaining space, but file creation fails with
No space left on device. I verify inode consumption using:df -iMillions of tiny session files or unpurged email queues frequently exhaust inode tables."
Question 3: Explain what happens at the network and kernel layer when a client establishes a TCP connection to your server.
Interviewer Intent: Evaluates deep networking knowledge, socket management, backlog queues, and SYN flood protection.
Strong Candidate Answer: "When a client initiates a TCP connection to an HTTP server like Nginx:
-
Three-Way Handshake:
- The client sends a TCP
SYNpacket to the server's listening port. - The Linux kernel network stack receives the
SYNand places the connection into the half-open SYN Backlog queue. The kernel responds withSYN-ACK. - The client replies with
ACK.
- The client sends a TCP
-
Accept Queue and Application Layer:
- Once the handshake completes, the kernel moves the connection from the SYN backlog to the fully established Accept Queue (governed by
net.core.somaxconnand the application'slisten()backlog parameter). - The application invokes the
accept()syscall to retrieve the socket file descriptor and begin processing HTTP requests.
- Once the handshake completes, the kernel moves the connection from the SYN backlog to the fully established Accept Queue (governed by
-
Production Failure Modes:
- SYN Floods: If malicious clients flood
SYNpackets without sending finalACKs, the SYN backlog fills up. SREs mitigate this by enabling TCP Syncookies (net.ipv4.tcp_syncookies = 1). - Accept Queue Drops: If the web server thread pool is saturated and cannot call
accept()fast enough, the accept queue overflows. The kernel silently drops subsequent incomingACKs or sends resets (RST). This can be detected vianetstat -s | grep -i listen."
- SYN Floods: If malicious clients flood
If you want to review containerized deployments and networking topologies further, explore our guide on Docker and Kubernetes interview questions.
Core Domain 2: Incident Management and On-Call Triage
Technical depth is meaningless if an engineer buckles under pressure. In SRE interviews, incident simulation questions test leadership, triage hierarchy, communication, and post-incident hygiene.
Question 4: A SEV-1 alert fires at 2:00 AM: the checkout API error rate has spiked to 35%. Walk me through your first 15 minutes.
Interviewer Intent: Assesses your calm methodical triage process, command presence, and prioritization of user mitigation over academic debugging.
Strong Candidate Answer: "Here is how I manage the first 15 minutes of a critical incident:
[00:00 - 02:00] Verify & Declare
  • Confirm user-facing impact
  • Declare SEV-1 incident in Slack/PagerDuty
  • Assign Incident Commander (IC) role

[02:00 - 07:00] Establish Blast Radius & Form Hypothesis
  • Check recent deployments & config changes
  • Inspect distributed tracing & latency spikes
  • Verify dependency health (DB, Redis, Third-party)

[07:00 - 12:00] Mitigate User Impact
  • Roll back recent canary or deploy
  • Enable feature flags / kill switches
  • Shed non-critical traffic or scale resources

[12:00 - 15:00] Status Communication & Stabilization
  • Update internal stakeholders via status page
  • Confirm metric recovery (error rate drops to baseline)
  • Preserve telemetry snapshots for postmortem
-
Step 1: Acknowledge, Verify, and Assume Command (Minutes 0–2): I acknowledge the page, verify user impact on high-level telemetry dashboards, and formally declare a SEV-1 incident. If I am the primary on-call, I establish myself as Incident Commander (IC) and set up a dedicated incident Slack channel and conference bridge. Clear roles prevent overlapping work.
-
Step 2: Isolate the Blast Radius and Form Hypotheses (Minutes 2–7): Before diving into code, I ask three rapid questions:
- What changed recently? Over 80% of production outages stem from recent deployments, config pushes, or database migrations within the last 30 minutes.
- Is the failure localized or global? Does the error rate affect a single region, a single canary pod, or all availability zones?
- Are downstream dependencies failing? Are third-party payment gateways timing out, or is our primary database connection pool exhausted?
-
Step 3: Mitigate Immediately (Minutes 7–12): The golden rule of incident management is mitigate first, troubleshoot root causes later.
- If a deployment occurred in the last 15 minutes, initiate an immediate rollback to the previous known good artifact.
- If a downstream dependency is dead, engage feature flag kill-switches or circuit breakers to graceful degradation mode.
- If traffic volume exceeds capacity, activate load shedding and rate limiting to preserve core service availability. For architectural strategies on request throttling, review our guide on rate limiting algorithms in system design.
-
Step 4: Communicate Status and Stabilize (Minutes 12–15): Once mitigation steps are executed, verify that error rates decline and p99 latency recovers. Post a clear update to the incident channel and customer-facing status page: 'Mitigation deployed; error rates decreasing to normal thresholds. Monitoring recovery.' Finally, preserve log snapshots and metrics before ephemeral pods terminate."
Question 5: How do you facilitate a blameless postmortem after a major outage?
Interviewer Intent: Evaluates emotional intelligence, psychological safety, and the ability to convert failures into resilient engineering improvements.
Strong Candidate Answer: "A blameless postmortem assumes that engineers act in good faith with the best information available at the time. If an engineer executed a command that dropped a production database, the root cause is never 'human error'—the root cause is that our system allowed a single command to drop a production database without automated safeguards, multi-party approvals, or immediate restore validation.
A strong postmortem includes:
- Objective Timeline: A chronological reconstruction of events (T0 alert, T1 response, T2 mitigation, T3 resolution), timestamped to UTC.
- Contributing Factors: Instead of searching for a single 'root cause', analyze the Swiss Cheese model—how did code review gaps, inadequate canary metrics, missing circuit breakers, and alert fatigue align to allow the incident?
- SMART Action Items: Every action item must be Specific, Measurable, Achievable, Relevant, and Time-bound. We classify them into:
- Preventative: Architectural fixes that make this class of failure physically impossible.
- Detective: Alerts or automated anomaly detectors to spot similar regressions in under 60 seconds.
- Mitigative: Automated self-healing runbooks or circuit breakers to minimize time-to-mitigate (TTM).
- Executive Summary & Sharing: Circulate the document openly across engineering teams to disseminate institutional knowledge."
When interviewers challenge you with behavioral follow-ups on handling tough technical mistakes, consult our advice on how to handle tough interview questions gracefully.
Core Domain 3: SLIs, SLOs, and Error Budgets
Site Reliability Engineering balances product velocity against system stability through mathematical Service Level Objectives.
Question 6: What is the exact distinction between SLI, SLO, and SLA? Provide concrete production examples.
Interviewer Intent: Checks whether you understand how reliability is quantified and contractually defined.
Strong Candidate Answer: "Here is the practical distinction:
| Term | Definition | Concrete Example |
|---|---|---|
| SLI (Service Level Indicator) | A carefully chosen quantifiable metric that measures service performance from the user perspective. | The ratio of successful HTTP requests (non-5xx) returning in under 200ms divided by total valid requests, measured over a rolling 30-day window. |
| SLO (Service Level Objective) | An internal engineering reliability target that the team commits to maintaining. | 99.9% of requests meet the SLI criteria over any rolling 30-day window. |
| SLA (Service Level Agreement) | A formal contractual agreement with external customers that incurs financial penalties, refunds, or credits if breached. | 99.5% availability, with a 10% credit provided if monthly availability dips below this threshold. |
The key takeaway is that your SLO must always be stricter than your SLA. The difference between your SLO and your SLA provides an engineering buffer that allows you to detect degradation, alert on-call engineers, and resolve problems before financial or contractual penalties trigger."
Question 7: How do you design and enforce an Error Budget Policy?
Interviewer Intent: Tests whether you know how to resolve tension between product managers pushing new features and reliability engineers guarding stability.
Strong Candidate Answer:
"An Error Budget is simply 100% - SLO. For a 99.9% availability SLO over a 30-day window, our error budget is 0.1% (allowing roughly 43 minutes of downtime per month).
The Error Budget is not a penalty; it is a currency that product and engineering teams spend on innovation and deployments.
Error Budget Enforcement Policy:
- Budget Healthy (>50% remaining): Development teams push features rapidly, deploy high-risk experiments, and conduct chaos engineering tests.
- Budget Depleted / Exhausted (<0% remaining):
- All non-critical feature releases and deployments are automatically halted.
- Engineering sprint capacity is immediately reallocated to technical debt, reliability improvements, observability pipelines, and test coverage.
- Releases only resume once the rolling error budget returns above threshold or after an executive risk exemption.
This policy aligns incentives: product managers want rapid releases, which motivates them to prioritize code quality and automated testing to keep the error budget green."
Core Domain 4: Cloud Infrastructure and Container Reliability
Modern SRE requires mastery of cloud platforms and container orchestration engines like Kubernetes and AWS.
Question 8: How do you debug a Kubernetes Pod stuck in CrashLoopBackOff?
Interviewer Intent: Evaluates practical CLI skills, container lifecycle understanding, and debugging workflows.
Strong Candidate Answer:
"CrashLoopBackOff indicates that Kubernetes started the container, but the container process terminated unexpectedly, prompting kubelet to retry restart attempts with an exponential backoff delay.
My diagnostic workflow:
# 1. Inspect Pod Events and Container Exit Code
kubectl describe pod <pod-name> -n <namespace>
In the State and Last State sections, I inspect the Exit Code:
- Exit Code 0: Container completed normally (often occurs if the container entrypoint was a short script rather than a long-running daemon).
- Exit Code 1: General application crash or unhandled runtime exception.
- Exit Code 137: Process terminated by
SIGKILL, almost always caused by Linux kernel OOM Killer due to exceedingresources.limits.memory. - Exit Code 143: Process received
SIGTERM, often initiated by Kubernetes during eviction or graceful shutdown.
# 2. Check Container Logs from the previous crashed run
kubectl logs <pod-name> -n <namespace> --previous
The --previous flag is vital because standard kubectl logs frequently shows nothing if the newly restarted container is in a starting state.
# 3. Check Liveness and Readiness Probes
If a pod's liveness probe fails repeatedly because initial startup takes 45 seconds while initialDelaySeconds is set to 10 seconds, kubelet will aggressively kill and restart the container forever."
For cloud-specific container deployment questions, review our deep dive into AWS interview questions for cloud engineers.
Question 9: How do you automate zero-downtime deployments with Canary Analysis?
Interviewer Intent: Checks whether you know how to build progressive delivery pipelines that detect regressions automatically.
Strong Candidate Answer: "A zero-downtime deployment relies on automated progressive delivery:
- Traffic Routing: Utilizing a service mesh (Istio) or ingress controller (Argo Rollouts), we deploy a new version alongside the current production deployment.
- Step-based Promotion: Direct 5% of production traffic to the canary version while 95% remains on the baseline.
- Automated Metric Analysis:
During the canary window, an automated analyzer queries Prometheus/Datadog to compare the canary against the baseline across three metrics:
- HTTP 5xx error rate ratio
- P95 and P99 latency distribution
- Container CPU and memory consumption
- Automated Rollback vs Promotion: If canary error rates exceed baseline by more than 0.2%, traffic is immediately shifted back to 100% baseline in under 30 seconds. If healthy, traffic progresses: 5% → 25% → 50% → 100%."
For version control workflows and release branch management, see our overview of Git interview questions.
Core Domain 5: Automation, Toil, and the 50% Rule
Question 10: How does Google SRE define toil, and how do you systematically eliminate it?
Interviewer Intent: Assesses your long-term engineering mindset versus passive manual operations.
Strong Candidate Answer: "According to the Google SRE framework, toil is operational work that exhibits specific characteristics:
- It is manual, repetitive, and automatable.
- It is devoid of enduring engineering value.
- It scales linearly with service growth (if traffic doubles, the manual work required doubles).
Examples of toil include manually approving certificate renewals, expanding disk volumes by hand, or restarting crashed services.
Managing and Eliminating Toil:
- The 50% Ceiling: SRE teams enforce a strict rule that no more than 50% of an engineer's time can be spent on operational tasks (on-call shifts, tickets, manual interventions). The remaining 50%+ must be dedicated to software development.
- Quantifying Toil: We log ticket categories in quarterly retrospectives. If one manual task consumes more than 4 hours weekly, it is prioritized into sprint engineering backlogs for automation.
- Self-Service Platforms: Rather than having SREs manually provision databases or configure firewall rules, we build internal developer platforms (IDPs) and Infrastructure as Code modules so developers can self-serve safely within automated guardrails."
Scenario-Based Mock Interview Simulation: Surviving the SRE Hot Seat
In modern SRE interview loops, theoretical mastery only gets you halfway to an offer. The decisive round is almost always an interactive incident simulation where the interviewer plays the role of an ambiguous alerting system and tests your real-time decision-making.
They will throw curveballs at you:
- "You rolled back the deployment, but latency is still climbing. What do you do next?"
- "The database administrator is insisting that the database is fine, but connection pools are saturated. How do you prove where the bottleneck lies?"
- "Your VP of Engineering asks for an estimated recovery time while you are still diagnosing. How do you respond?"
The only way to develop muscle memory for these high-stress rounds is through realistic, scenario-based practice. Practicing with an interactive AI mock interview platform like totop.app allows you to simulate live on-call troubleshooting sessions, receive instant feedback on your diagnostic structure, and hone your technical communication before you face real interview panels.
Frequently Asked Questions (FAQ)
What is the difference between DevOps and SRE?
DevOps is a philosophy and cultural movement focused on breaking down silos between software development and IT operations to accelerate delivery velocity. SRE is a concrete implementation of DevOps principles using software engineering methodologies, specific metrics (SLIs/SLOs), and strict error budget policies.
What programming languages should an SRE know for interviews?
Most modern SRE interviews focus on Python or Go (Golang). Python is widely used for scripting, automation, and data analysis, while Go is the dominant language for cloud-native infrastructure tooling (Kubernetes, Terraform, Prometheus, Docker).
How important is LeetCode for SRE interviews?
While SRE interviews typically do not require solving complex LeetCode Hard dynamic programming problems, you should comfortably solve LeetCode Easy and Medium problems involving hash tables, string manipulation, queues, and tree/graph traversals, with a strong focus on clean, production-grade code.
What are the Four Golden Signals of monitoring?
Defined by Google SRE, the Four Golden Signals are:
- Latency: The time it takes to service a request (distinguishing success latency from error latency).
- Traffic: A measure of demand on your system (e.g., HTTP requests per second or concurrent transactions).
- Errors: The rate of requests that fail, either explicitly (HTTP 500) or implicitly (wrong content returned).
- Saturation: How full your most constrained service resources are (CPU, memory, disk I/O, database thread pools).
Summary Checklist for SRE Candidates
Before your next interview, ensure you can comfortably:
- Diagram the Linux kernel packet path from NIC to socket buffer.
- Calculate rolling 30-day error budgets from uptime percentages.
- Command an incident triage bridge using structured, blameless communication.
- Diagnose high I/O wait, memory leaks, and CPU steal using native terminal tooling.
- Articulate concrete strategies to eliminate operational toil using software automation.
Practice your answers, simulate live production incidents on totop.app, and approach your interview with the calm, methodical mindset of a seasoned reliability engineer.