We’ve all done it.
You encounter a weird bug where a user profile object is returning undefined. You open your editor, add console.log('HERE 1', user), save the file, switch to the browser, reload, check the console, and see [object Object]. Frustrated, you change it to console.log('HERE 2', JSON.stringify(user, null, 2)).
Ten minutes later, your terminal looks like a crime scene flooded with hundreds of unformatted objects, random numbers, and cryptic text markers like console.log('asdfasdf'). And if we're being completely honest, at least once in your career, one of those stray console.log('WTF IS THIS') calls accidentally made it all the way to production.

While console.log() is the most ubiquitous debugging tool in modern web development, relying on it as your primary diagnostic mechanism is like diagnosing engine trouble by kicking the tires. It is slow, destructive to code quality, and misses 90% of what your runtime is actually doing.
Here is why it's time to retire console.log() for daily troubleshooting—and what modern tools and techniques you should be using instead.
The Hidden Cost of console.log() Driven Debugging
Before looking at the alternatives, let's understand why print-statement debugging actively slows you down:
- State Mutation Traps: In modern browsers,
console.log()evaluates object references lazily when you expand them in the DevTools drawer. If an object mutates after your log call, what you inspect on screen might not reflect the actual state at the exact moment the log executed. - Pollution and Memory Overhead: Leaving hundreds of log statements in hot code loops creates GC (Garbage Collection) pressure and degrades application frame rates.
- Context Breakdown: A raw string in a console window gives you no call stack, no scope variables, and no async execution path without extra boilerplate.
1. Upgrade Your Console Game (If You Must Log)
If you need quick visual feedback without attaching a full debugger, the native console object offers far richer utilities than standard .log():
Visualizing Collections with console.table()
Instead of expanding nested arrays of objects one by one, format tabular data instantly:
const users = [
  { id: 1, name: 'Alex', role: 'Frontend Lead', status: 'Active' },
  { id: 2, name: 'Taylor', role: 'DevOps Engineer', status: 'Pending' },
  { id: 3, name: 'Morgan', role: 'Backend Lead', status: 'Active' }
];

// Instead of console.log(users)
console.table(users, ['name', 'role', 'status']);
This renders a clean, sortable interactive table right inside your browser DevTools or terminal.
Grouping Related Logic with console.group()
Prevent wall-of-text console noise by collapsing sub-routines into logical hierarchies:
function processOrder(order) {
  console.groupCollapsed(`Order #${order.id} Processing`);
  console.log('Validating payment info...', order.payment);
  console.log('Calculating shipping taxes...', order.tax);
  console.groupEnd();
}
Performance Benchmarking with console.time()
Stop calculating manually with Date.now() subtraction:
console.time('fetchUserData');
await fetch('/api/user/profile');
console.timeEnd('fetchUserData'); // Output: fetchUserData: 42.18ms
2. Master Interactive Breakpoint Debugging
The true superpower of modern software engineering is stopping time.

Instead of editing source files, re-saving, and waiting for hot-module reloading, leverage breakpoints directly in your IDE (VS Code, WebStorm) or Browser DevTools (Chrome, Firefox, Safari).
The debugger; Statement
Dropping debugger; into your source code acts as an programmatic breakpoint:
function calculateCartTotal(cartItems) {
  const taxRate = 0.08;

  // Execution pauses here automatically if DevTools is open!
  debugger;

  return cartItems.reduce((acc, item) => acc + (item.price * item.quantity), 0);
}
When execution pauses, you instantly gain superpowers:
- Scope Inspection: View all local, closure, and global variables in real-time without logging them.
- Call Stack Navigation: Trace back through the parent functions that invoked the current execution frame.
- Live Expression Evaluation: Test potential fix expressions live in the console drawer against the current state before editing code.
Conditional Breakpoints
Tired of clicking "Continue" 50 times inside a for loop until i === 49? Right-click any line number in Chrome DevTools or VS Code and select Add Conditional Breakpoint.
Enter an expression like user.id === 'usr_9821'. Execution will only pause when that specific condition evaluates to true.
3. Switch to Structured Logging for Production & Node.js
For backend services, microservices, and server-side rendering (SSR) environments, raw console.log() is an anti-pattern because log aggregators (Datadog, Grafana Loki, CloudWatch) cannot query unformatted text efficiently.
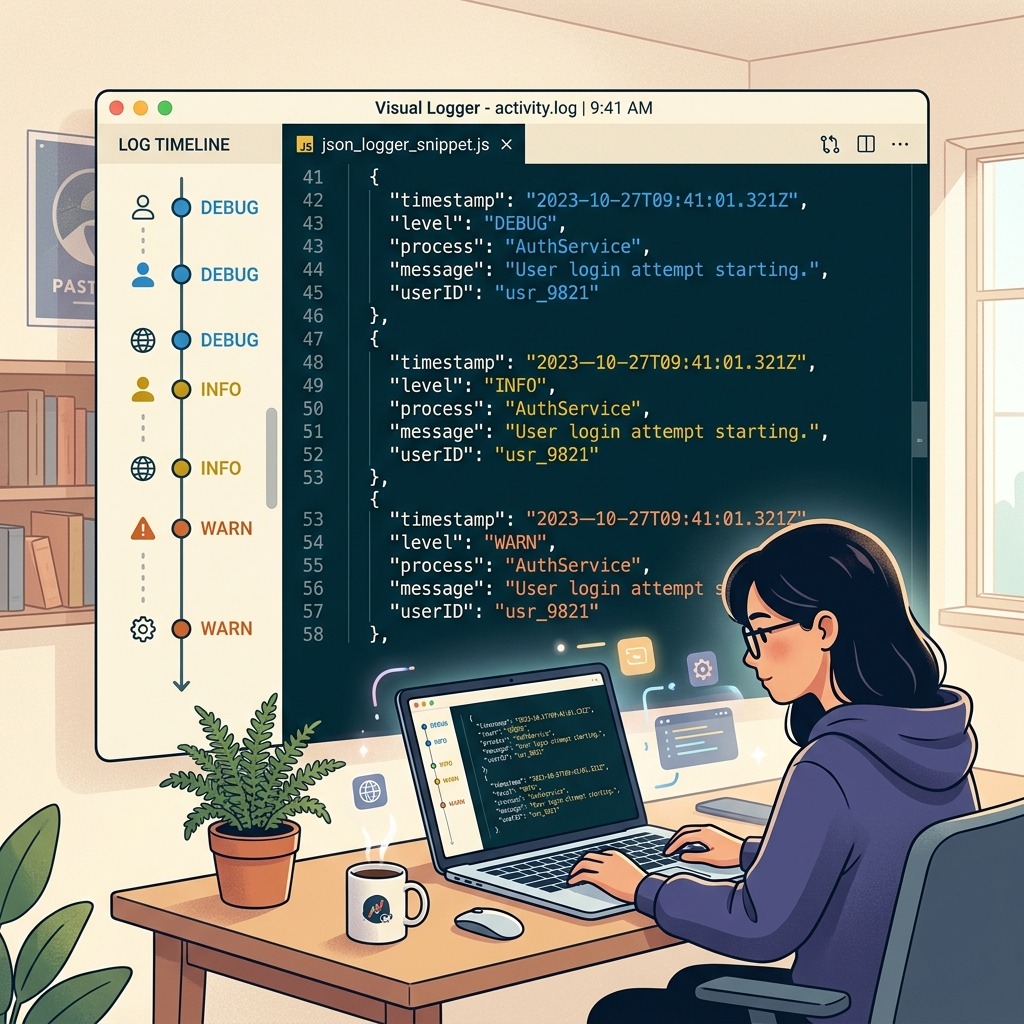
Instead, adopt high-performance, structured loggers like Pino or Winston.
import pino from 'pino';

const logger = pino({
  level: process.env.LOG_LEVEL || 'info',
  transport: process.env.NODE_ENV !== 'production' ? { target: 'pino-pretty' } : undefined
});

// Logs structured JSON in production, pretty text in development
logger.info({ userId: 'usr_9821', action: 'checkout_initiated' }, 'User started checkout process');
Why this wins:
- Zero-Cost Inactive Levels: If log level is
info,logger.debug()calls execute in micro-nanoseconds with zero formatting overhead. - Machine Readability: JSON log events can be parsed, filtered, and alerted on automatically by observability stacks.
Advanced JavaScript & Node.js Debugging Reference Table
When debugging complex state mutations, asynchronous race conditions, or performance regressions during a live coding or bug-squash interview, choosing the right console or DevTools primitive saves critical minutes:
| Debugging Method | When to Use It Instead of console.log() | Key Advantage in Live Debugging |
|---|---|---|
console.table(arrayOfObjects, ['id', 'status']) | Inspecting API responses, Redux/Zustand slices, or DP matrices. | Renders a sortable, aligned tabular grid instead of collapsed object trees. |
console.trace('State mutated here') | Finding which caller triggered an unexpected re-render or state update. | Prints the full synchronous & async call stack directly to the console. |
console.time('query') / console.timeEnd('query') | Comparing two algorithm implementations or measuring render bottlenecks. | Outputs sub-millisecond elapsed wall-clock duration with zero boilerplate. |
console.dir(element, { depth: null }) | Inspecting deeply nested ASTs, JSON trees, or DOM node properties. | Bypasses the default 2-level object truncation in Node.js terminal output. |
| Conditional Breakpoints / Logpoints | Debugging inside a 10,000-iteration loop (e.g., when i === 412 && sum < 0). | Pauses or logs in Chrome DevTools / VS Code without modifying source files. |
debugger; Statement | Stepping through closure variables and this binding in real time. | Freezes execution immediately when DevTools is open, exposing the full Scope pane. |
Why console.log(obj) Lies About Mutated Objects in Chrome DevTools
A classic frontend interview trap is logging a mutated object or array across multiple steps: console.log(state); state.count += 1;. In browser DevTools, object references are evaluated lazily when you click the triangle arrow to expand them, meaning all your earlier console.log(state) lines will display the final mutated value rather than the state at the moment console.log ran! To capture an accurate point-in-time snapshot without mutating references, log structuredClone(state), JSON.stringify(state), or use console.table(state) which eagerly formats primitive columns immediately. Pairing these structured console methods with Chrome DevTools Logpoints keeps your source tree completely clean during live pair-programming interviews, prevents leftover debug statements from polluting production pull requests, and helps you isolate asynchronous state bugs in seconds.
Summary: Building Better Debugging Habits
Moving away from console.log() isn't just about cleaner code—it's about working faster and reducing cognitive load. Next time you catch yourself reaching for a print statement:
- Try placing a conditional breakpoint in your IDE or browser first.
- Use
console.table()orconsole.group()if you need temporary visual structure. - Implement structured logging for backend microservices.
- Enforce linters (
no-consolerule in ESLint) to catch stray logs before they reach pull requests.
Whether you're prepping for technical interviews or scaling production software, mastering real-world debugging workflows separates junior developers from senior engineers.
Looking to level up your technical interview prep and software engineering skills? Practice real-world coding problems, system design challenges, and behavioral questions with interactive guidance at totop.app.
Practice Full Stack Engineer Questions Live with AI Mock Interviews
Turn any job description across Engineering, DevOps, Data, Marketing, Sales, Finance, or HR into a personalized test and live voice or text AI mock interview on totop.app, or test your speed right now in the 60-Second Full Stack Engineer Blitz.
Play 60s Full Stack Engineer Blitz (Free, No Login) | Start 14-Day Free Trial | Browse All Interview Guides